Dashboard Guide
The ScreenStop Dashboard is the central management console for all protected workstations. From here, IT administrators can monitor events, push configuration changes, and control detection behavior across the fleet.
Accessing the Dashboard
The dashboard is a web application hosted on your organization's server.
Default credentials are set by your IT administrator at deployment time.
Password requirements
Passwords must be at least 12 characters and include uppercase, lowercase, a number, and a special character. The default admin/admin is not accepted for normal login — it works only as a temporary dev-mode bootstrap to create the first admin (see Docker Deployment — Bootstrap Admin Account), then is disabled.
Docker deployment
For containerised enterprise deployments, see Docker Deployment.
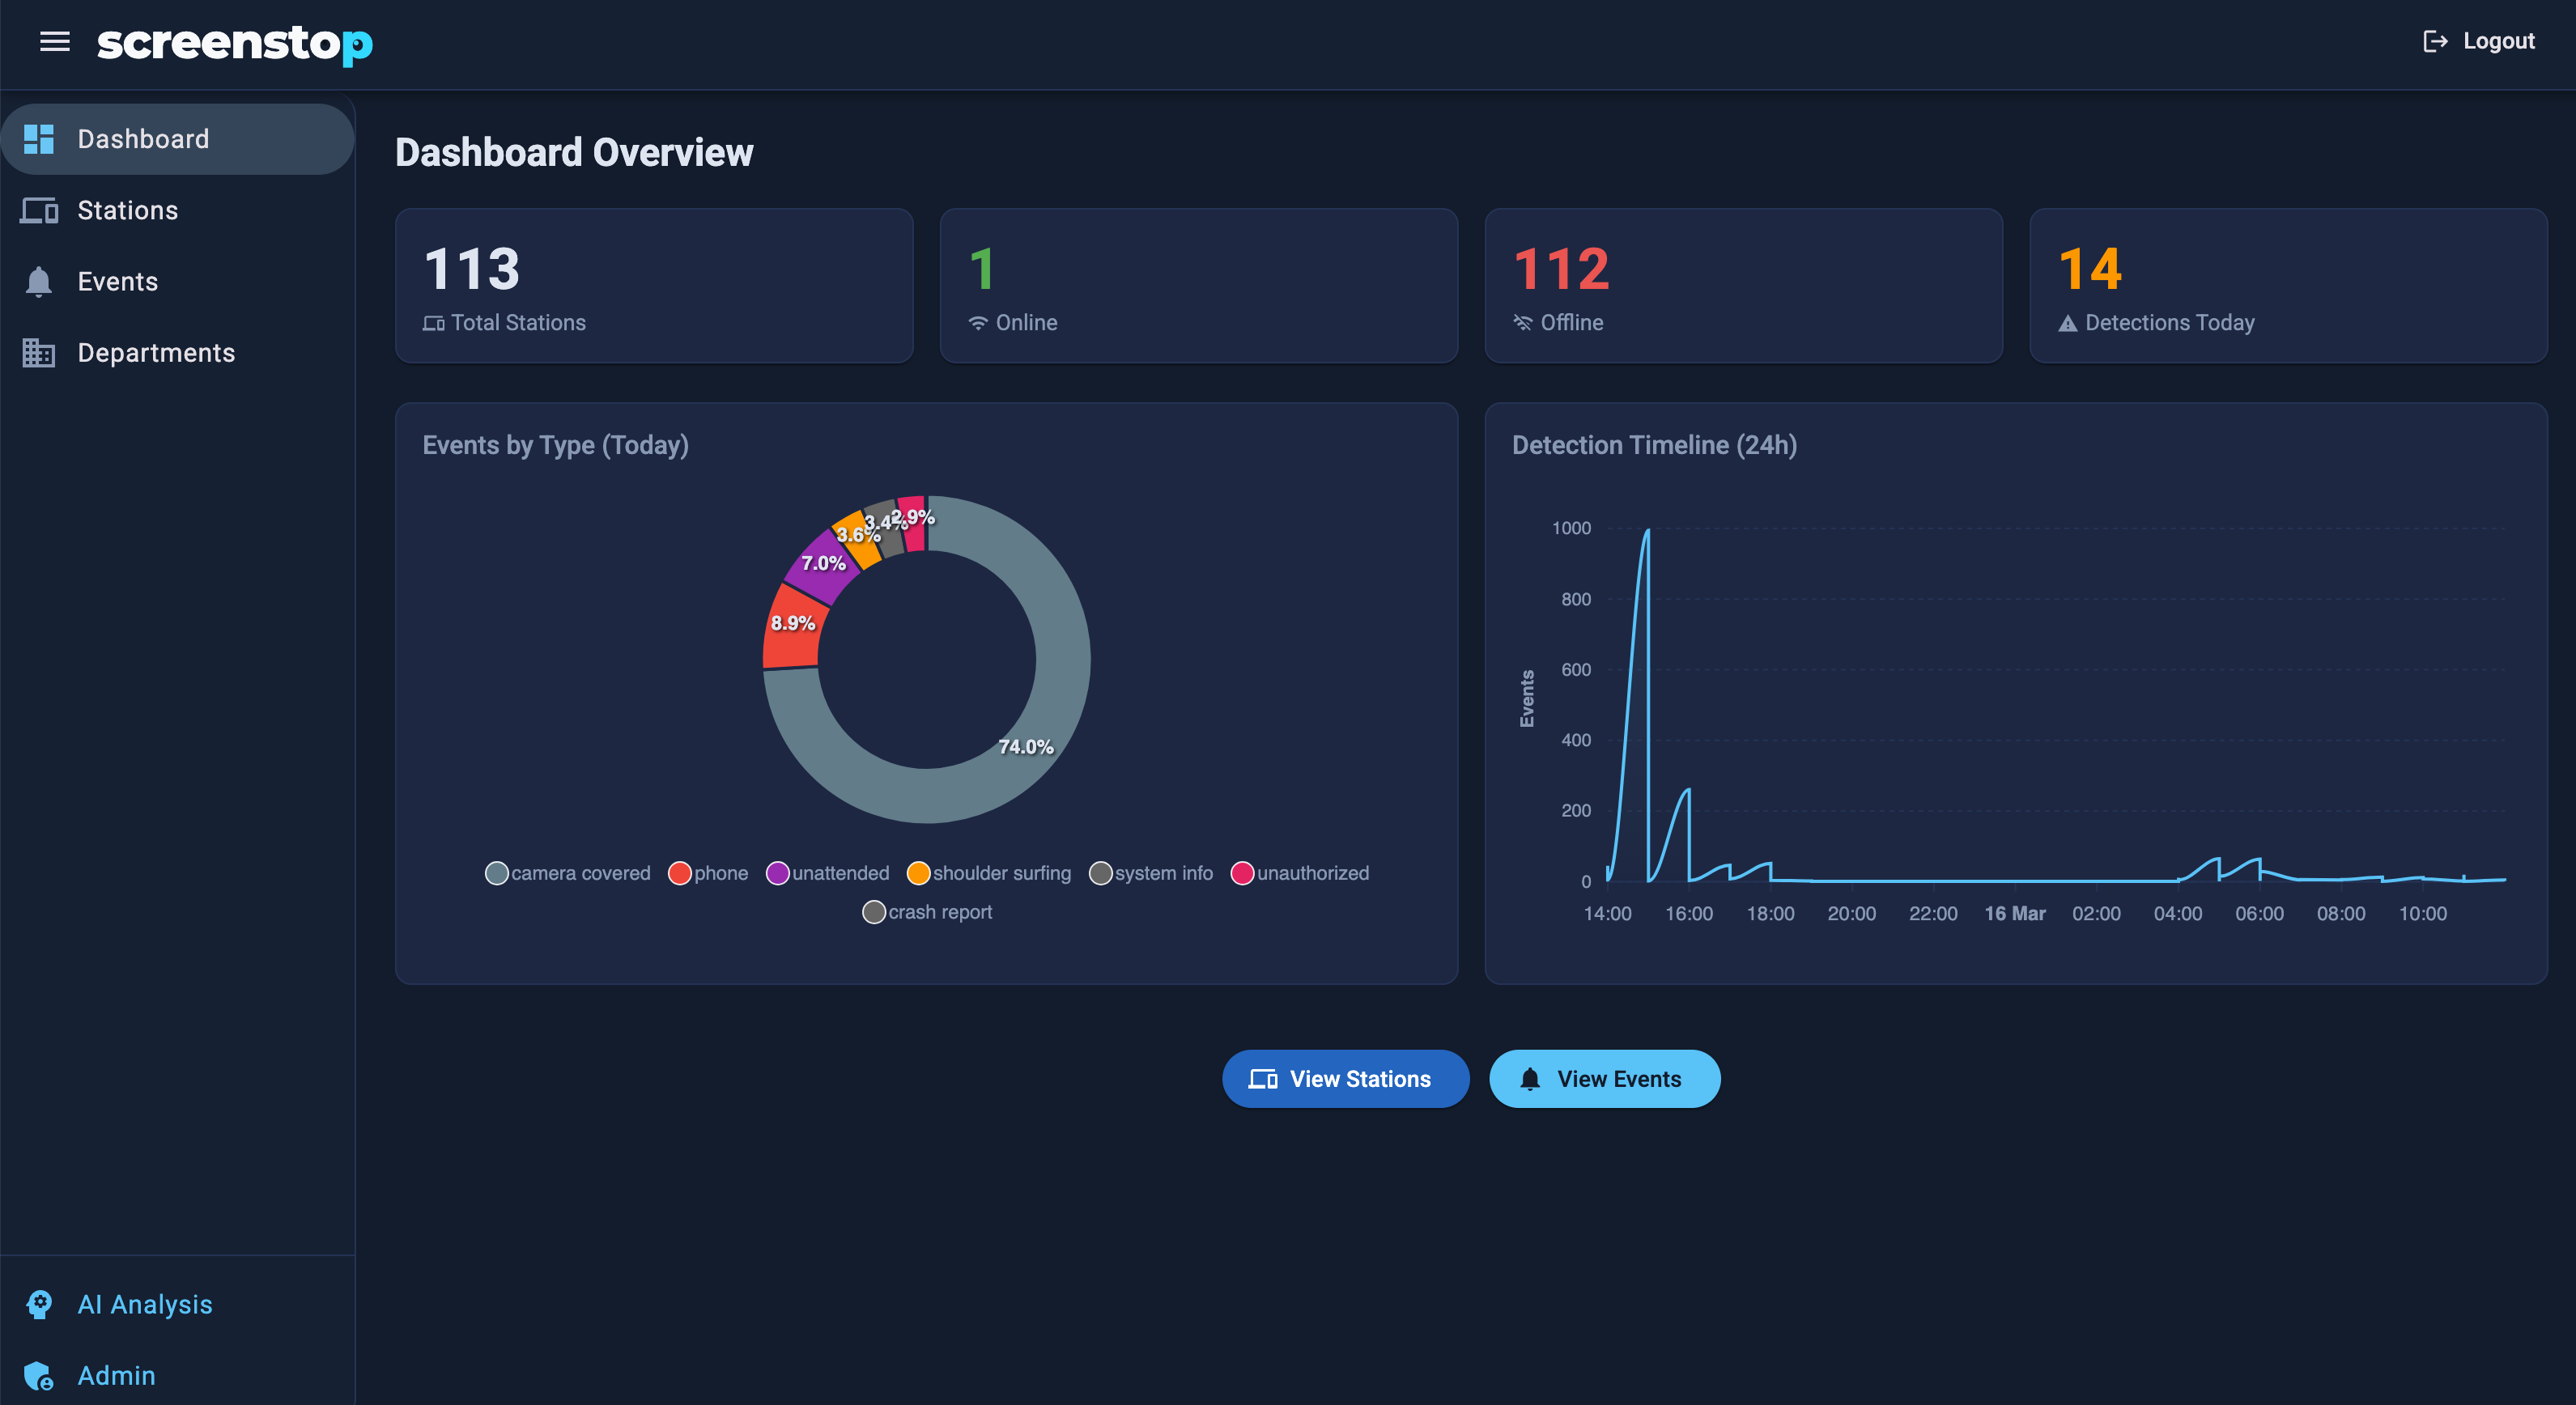
Station List
The main view shows all registered stations:
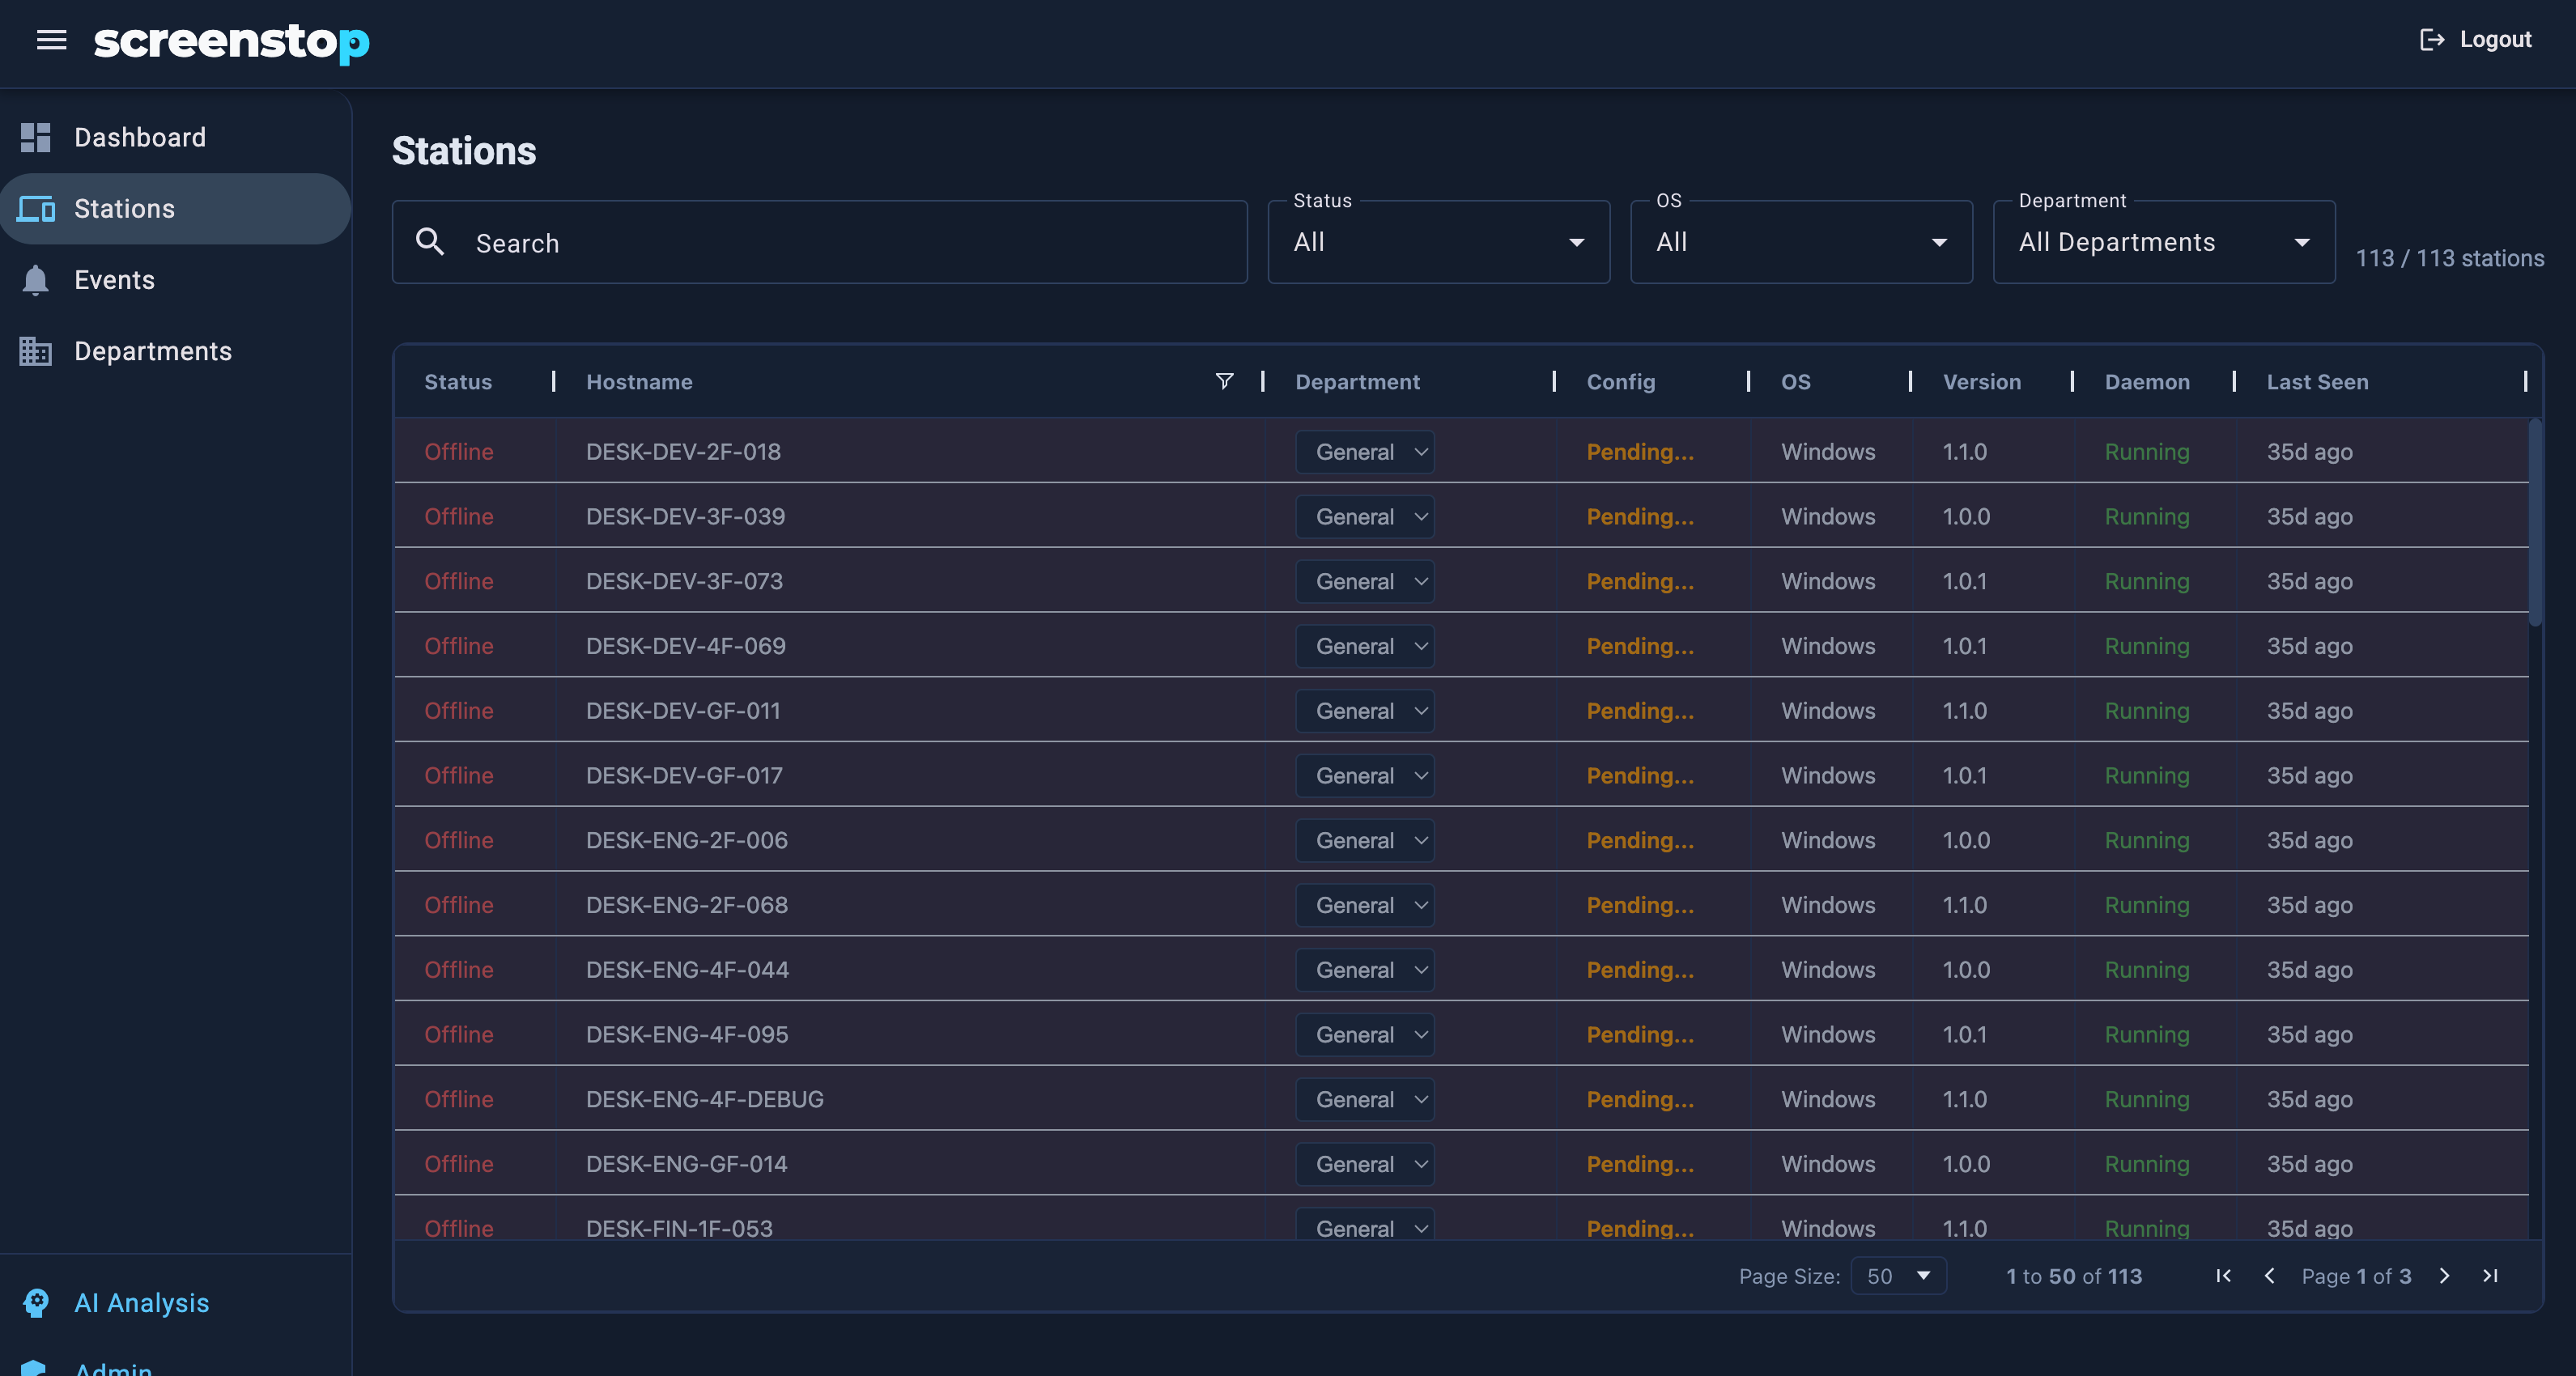
- Status indicator — green when online, grey when last seen >5 min ago
- Last seen timestamp
- Device ID — unique identifier per machine
- Detection events count
Stations register automatically the first time ScreenStop runs and contacts the dashboard.
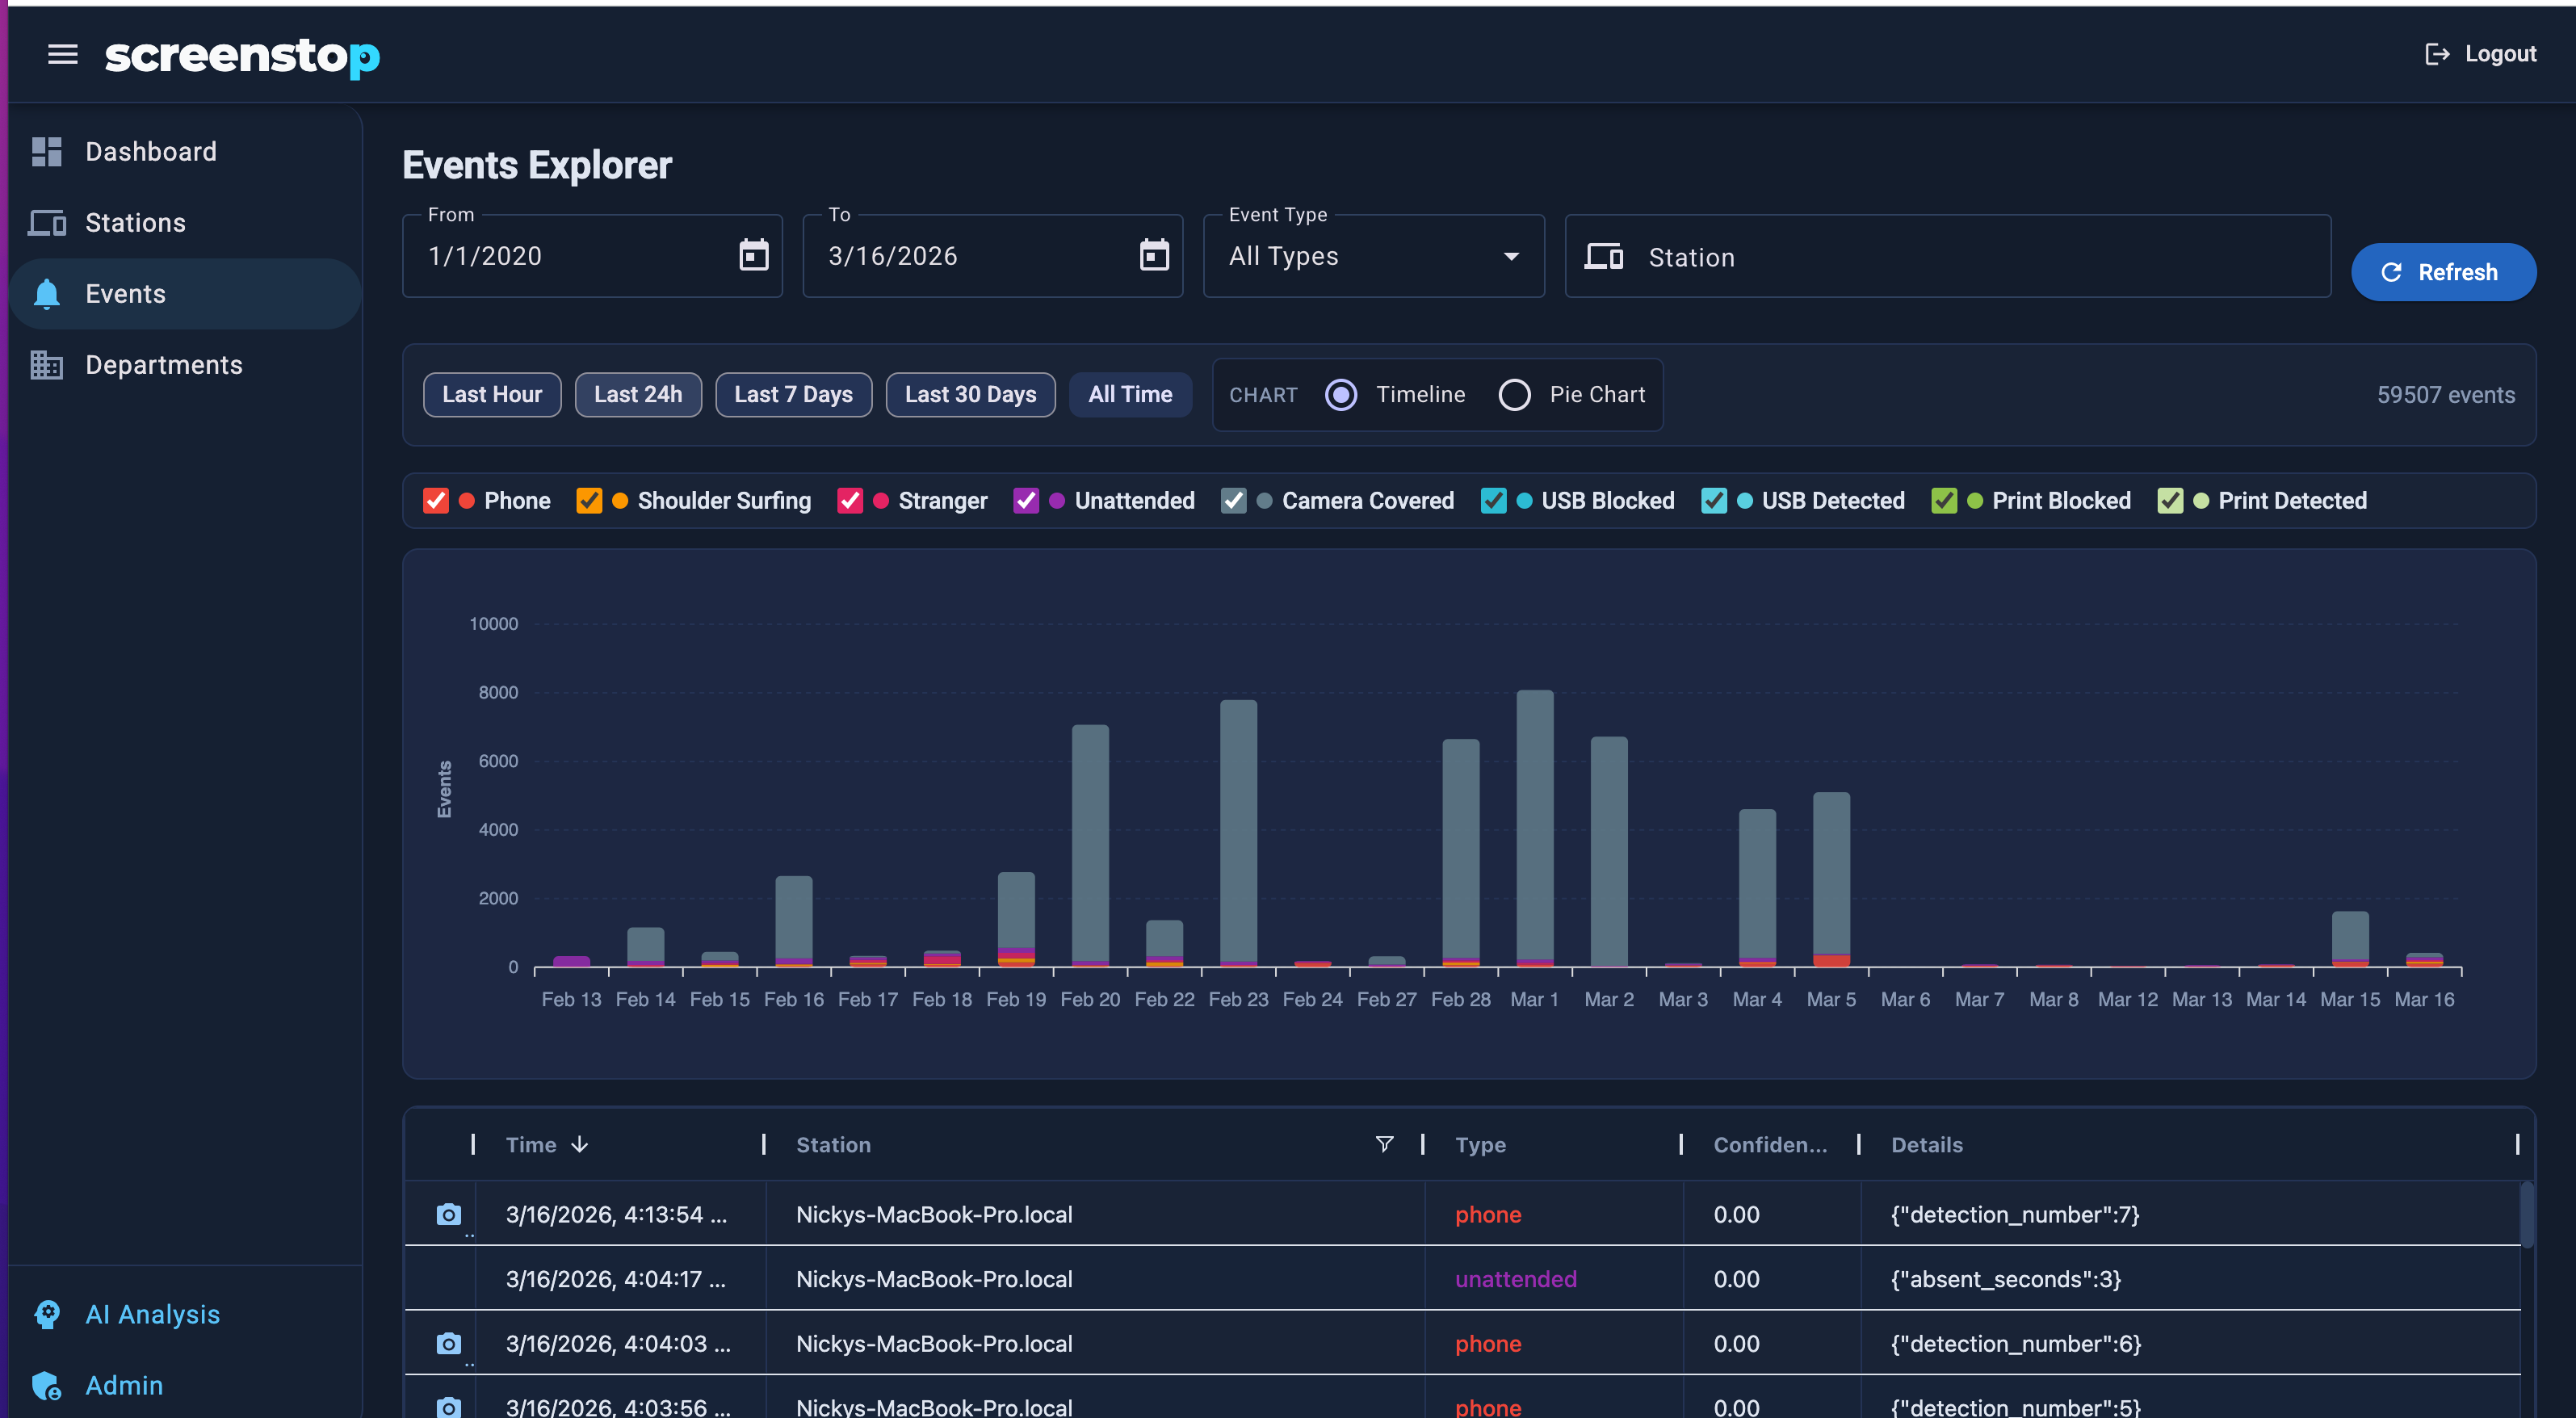
Event Feed
Each station reports events in real time:
| Event Type | Trigger |
|---|---|
phone |
Phone pointed at screen |
unauthorized_face |
Unrecognized person detected |
shoulder_surfing |
Multiple faces detected |
unattended |
No face detected for configured duration |
camera_covered |
Camera lens blocked |
usb_blocked |
USB drive ejected (USB Protection active) |
usb_detected |
USB drive detected (Audit Mode — no eject) |
print_blocked |
Print job cancelled (Print Protection active) |
print_detected |
Print job detected (Audit Mode — no cancel) |
camera_error |
Camera disconnected or read failure — station retries for 30s, then marks itself offline |
Events include a timestamp, device ID, confidence score, and detection details. Events with Debug Mode active include a camera frame — click the camera icon in the event row to view the snapshot.
The Mode column flags events captured while the station's department was in silent mode (Audit Mode — detected and logged, no enforcement). This makes it easy to see, at a glance, which detections were monitored vs. enforced — useful while baselining before you go live.
Departments
Departments group stations and push a shared policy to all stations in the group.
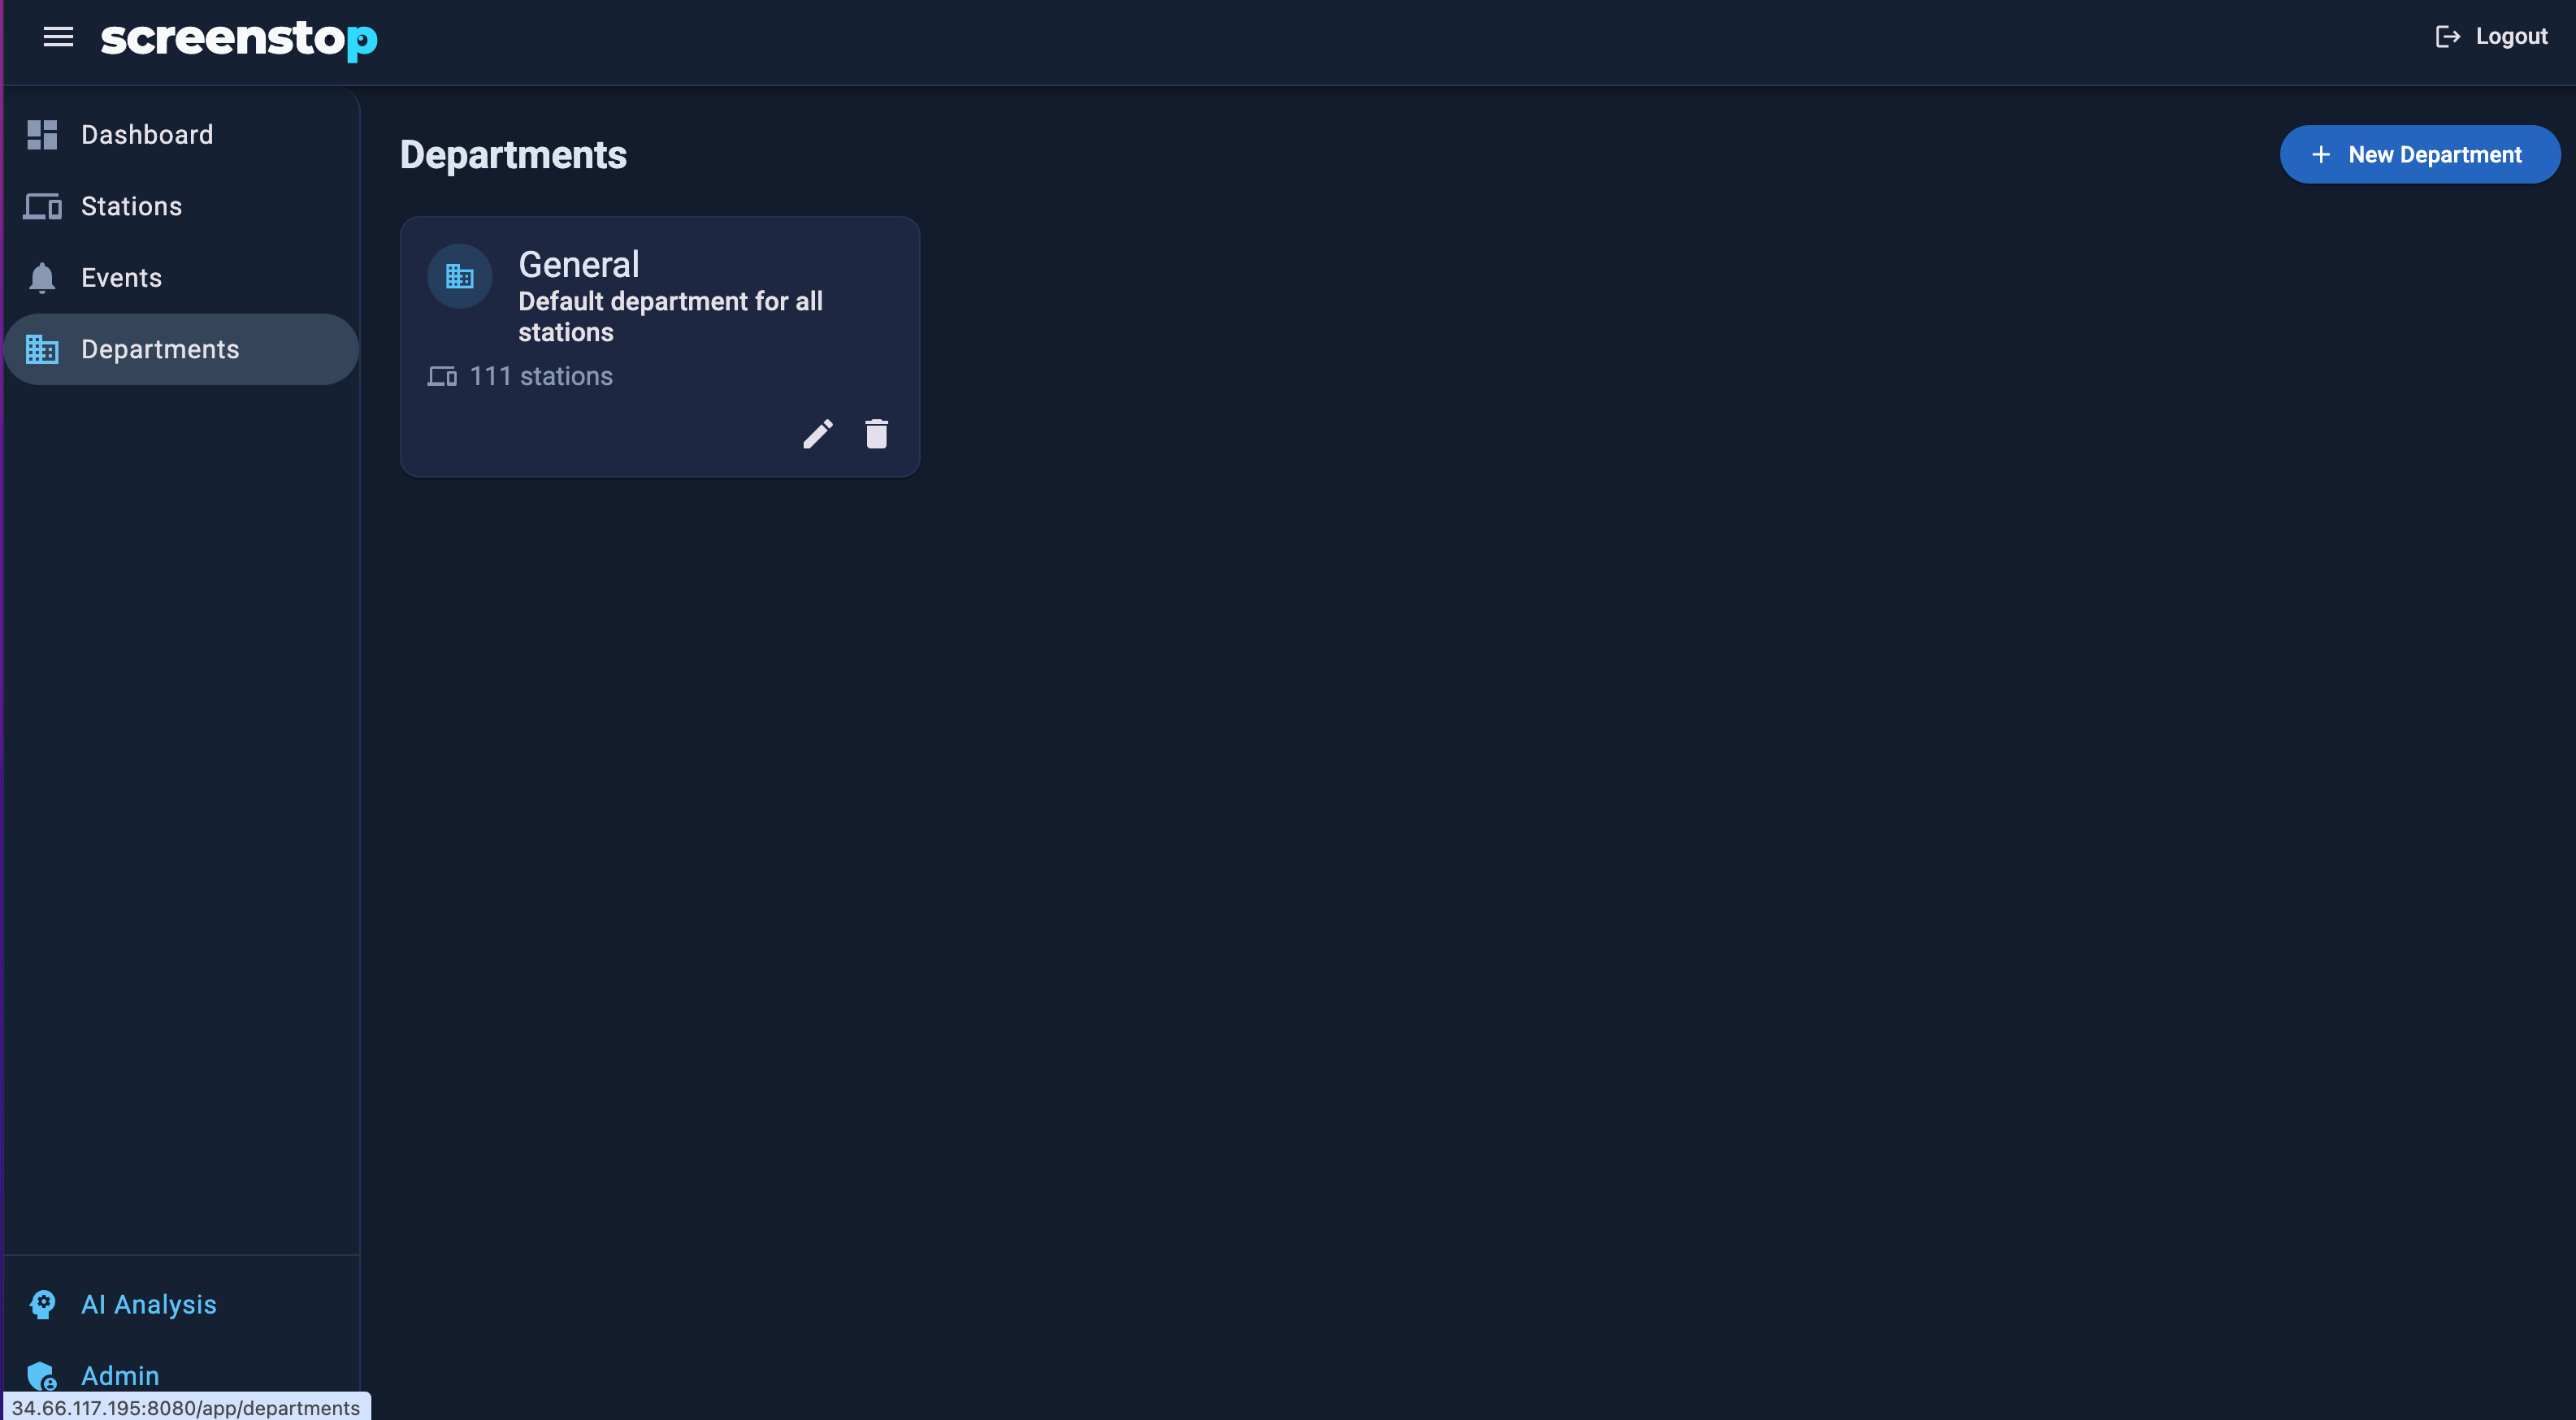 Policy changes apply to all stations in the department within ~5 seconds.
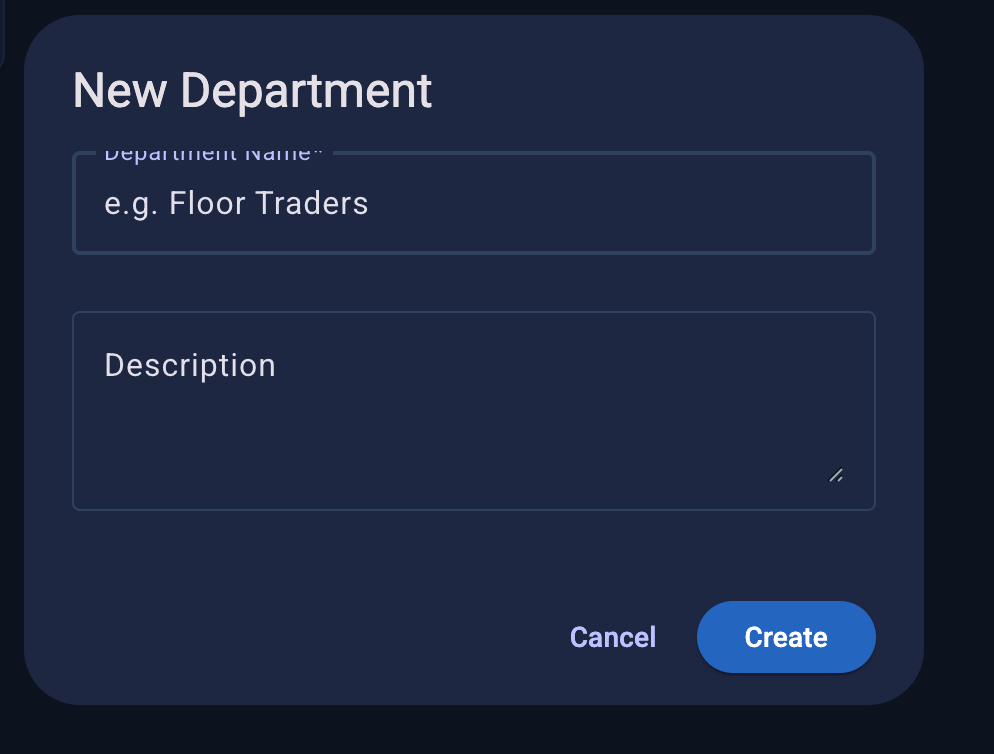
To create a department:
- Go to Departments > New Department
- Name it (e.g. "Finance", "HR", "R&D")
- Assign stations to the department
Department Policy (v2.0)
Each department has an Endpoint DLP policy card and an Audit & Capture Policy card. These settings are pushed to all stations in the department automatically.
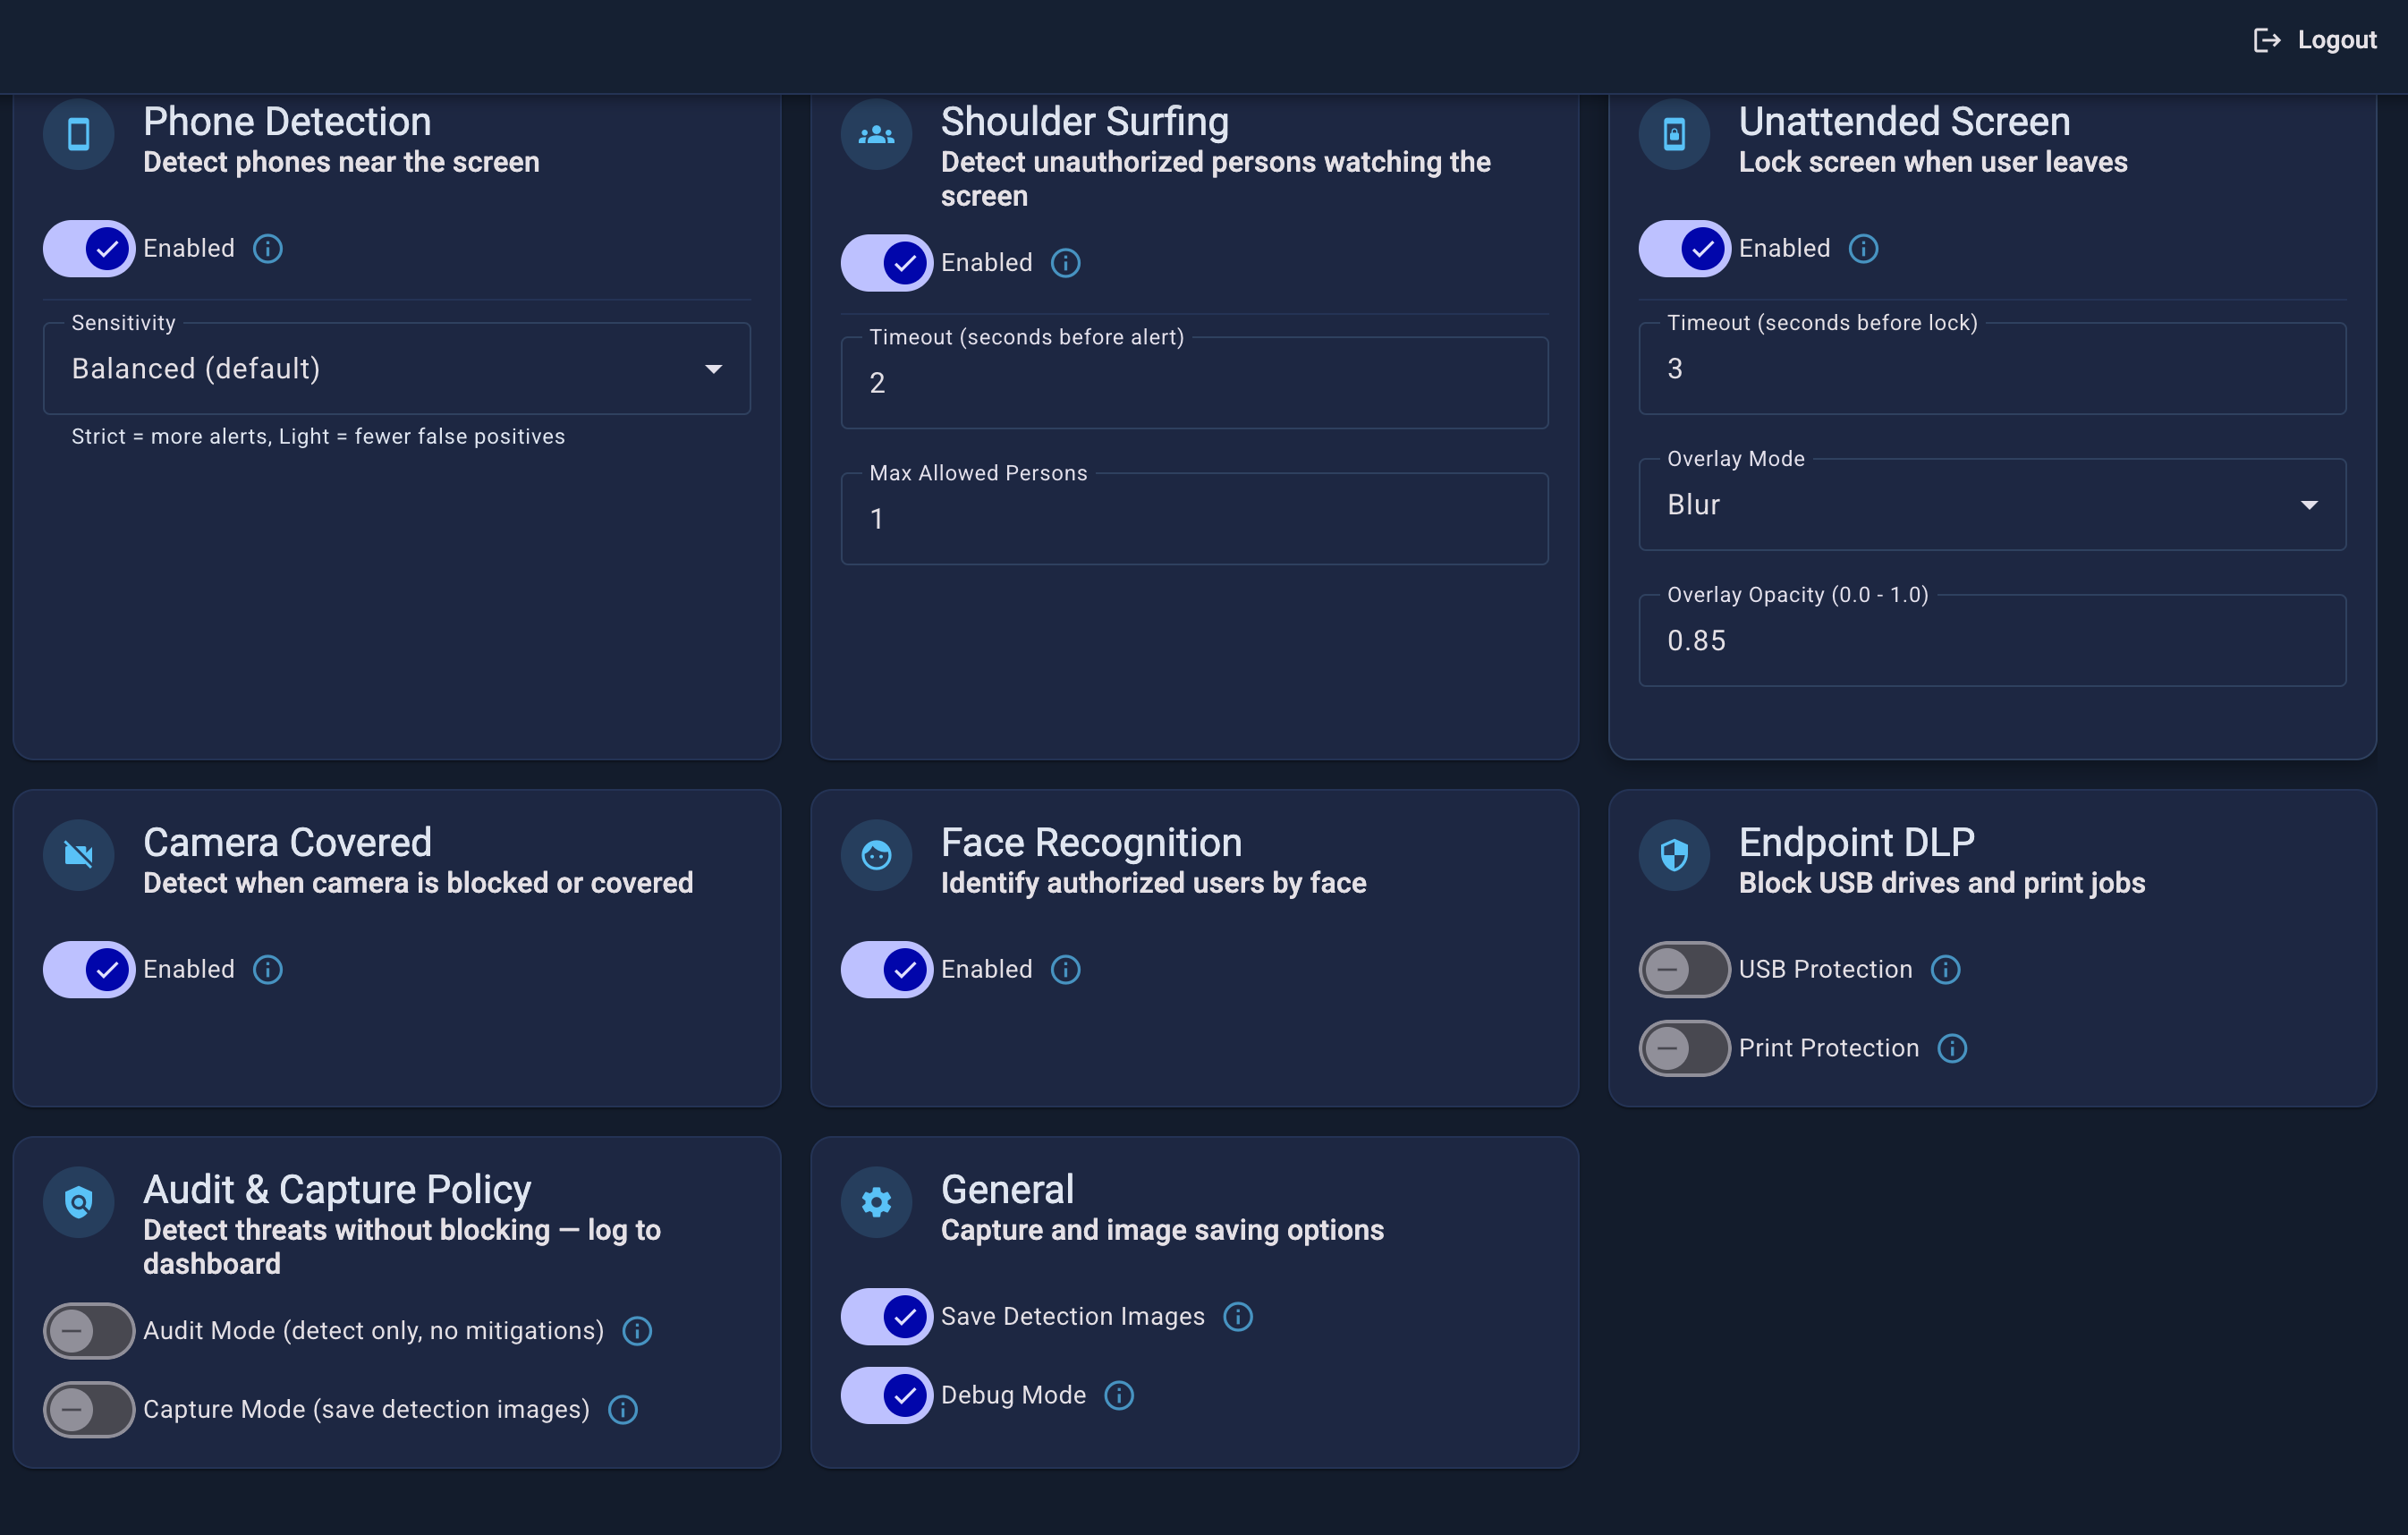
Audit Mode (silent monitoring)
Detections fire and events are logged, but no action is taken (no lock, no blur, no USB eject, no print cancel).
On by default for new installs
The out-of-box General department starts with Audit Mode on, so stations begin in silent mode the moment they connect — events flow with no user disruption. You turn enforcement on yourself, per department, once you've verified everything works. See Rollout / Going Live.
To turn enforcement on (or back to silent) for a department:
- Go to Departments > select a department
- Open the Audit & Capture Policy card
- Toggle Audit Mode off (to enforce) or on (to stay silent)
- Click Save — all stations in the department switch within ~5 seconds
Tip
Run silent for 1–2 weeks before enforcing. Review the event feed to baseline normal behaviour and tune sensitivity per threat. Then disable Audit Mode to go live.
Capture Mode (Department Policy)
Saves a camera snapshot to local disk on the station for every detection event.
To enable Capture Mode:
- Go to Departments > select a department
- Open the Audit & Capture Policy card
- Toggle Show Detection Images in Events on
- Click Save
Snapshots are saved locally on the station in the detections/ folder. The daemon keeps the last 100 images (auto-cleanup).
Add Screen Capture to Detection Images
When enabled, a screenshot of the screen content is captured before the blur overlay fires and combined with the camera frame. The combined image shows both who was detected and what data was visible at the moment of the incident.
To enable:
- Go to Departments > select a department
- Open the Audit & Capture Policy card
- Toggle Add Screen Capture to Detection Images on
- Click Save
Privacy
This captures whatever is on the screen. Enable only where your data retention policy permits it and employees have been informed.
This is different from per-station Debug Mode
Department Capture Mode saves frames to the station's local disk for compliance retention. Per-station Debug Mode (toggle on the station page) streams frames live to the dashboard for active investigation.
USB Protection
Automatically ejects USB storage drives unless an authorized person is at the workstation.
To enable USB Protection:
- Go to Departments > select a department
- Open the Endpoint DLP card
- Toggle USB Protection on
- Click Save
Tip
Enable Audit Mode first to see usb_detected events in the feed before switching to enforcement (usb_blocked).
Print Protection
Cancels print jobs unless an authorized person is at the workstation.
To enable Print Protection:
- Go to Departments > select a department
- Open the Endpoint DLP card
- Toggle Print Protection on
- Click Save
Per-Station Settings
Individual station settings are configured from the station detail page.
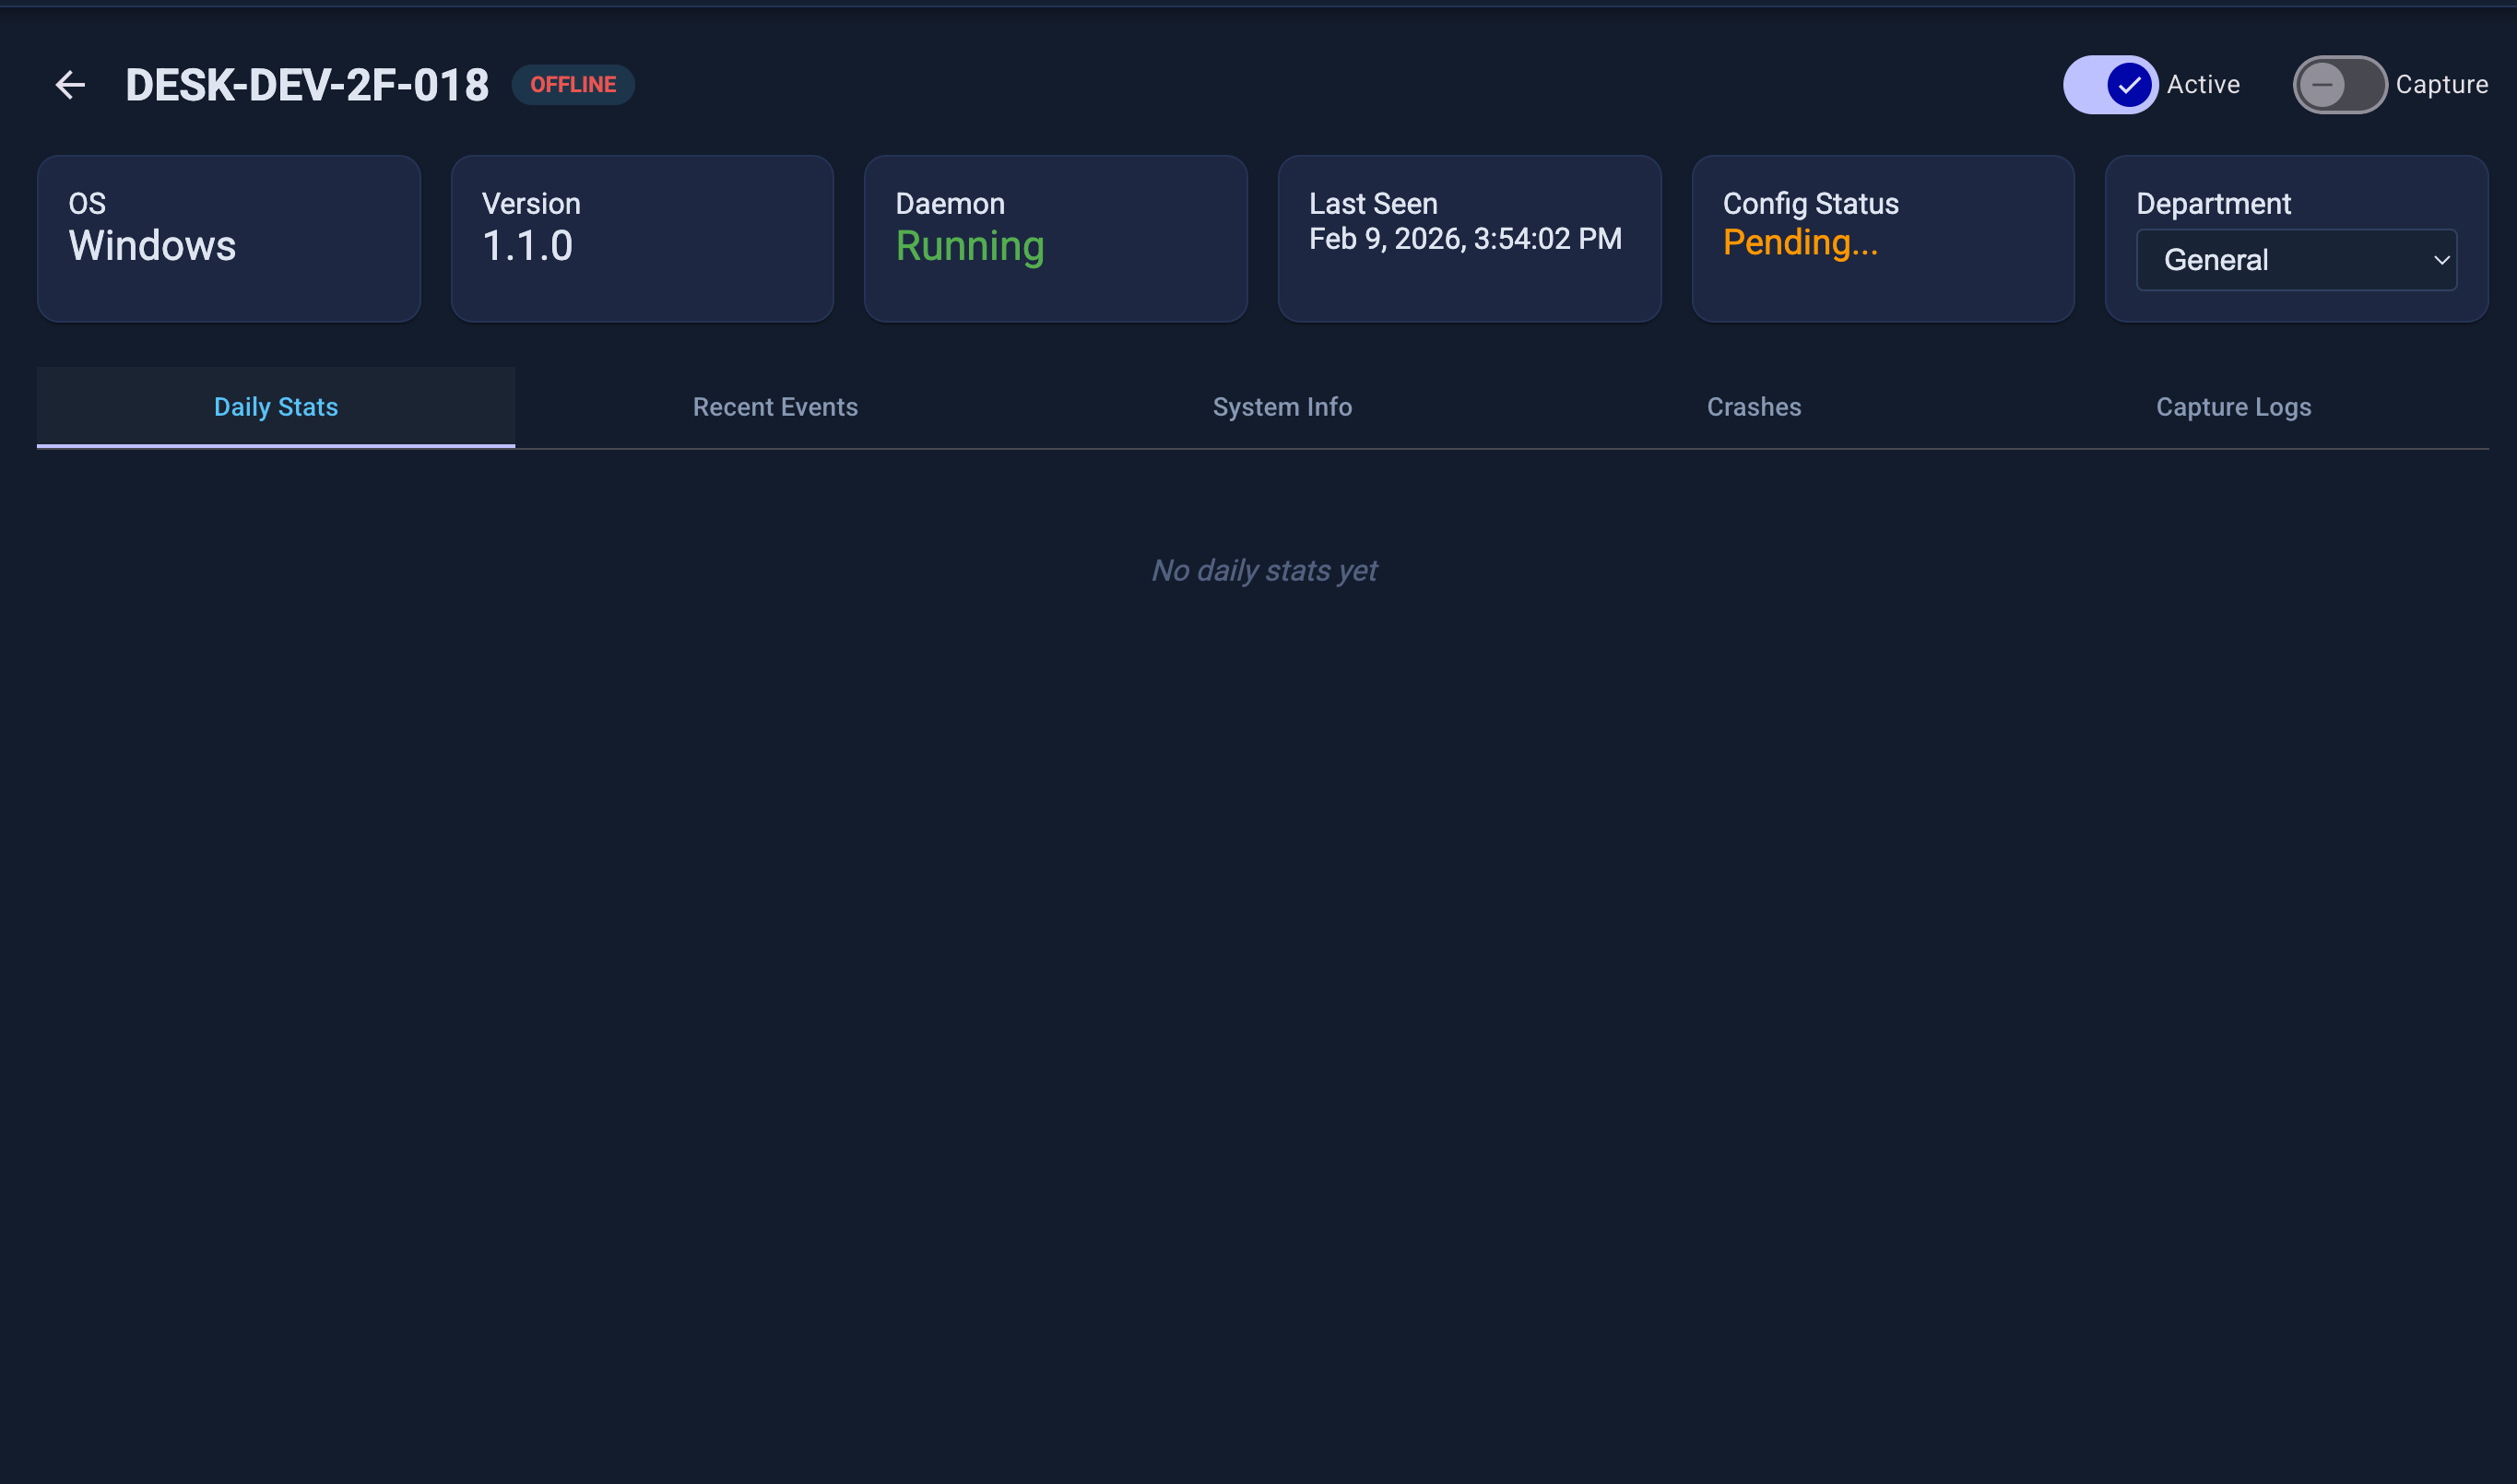
To configure a station:
- Go to Stations > click a station
- Adjust settings in the configuration panel
- Click Save — changes sync within ~5 seconds
Note
No restart is required. The daemon reads updated config on its next detection cycle.
Debug Mode (Per-Station)
Debug Mode enables live log streaming and sends camera frames to the dashboard with each detection event.
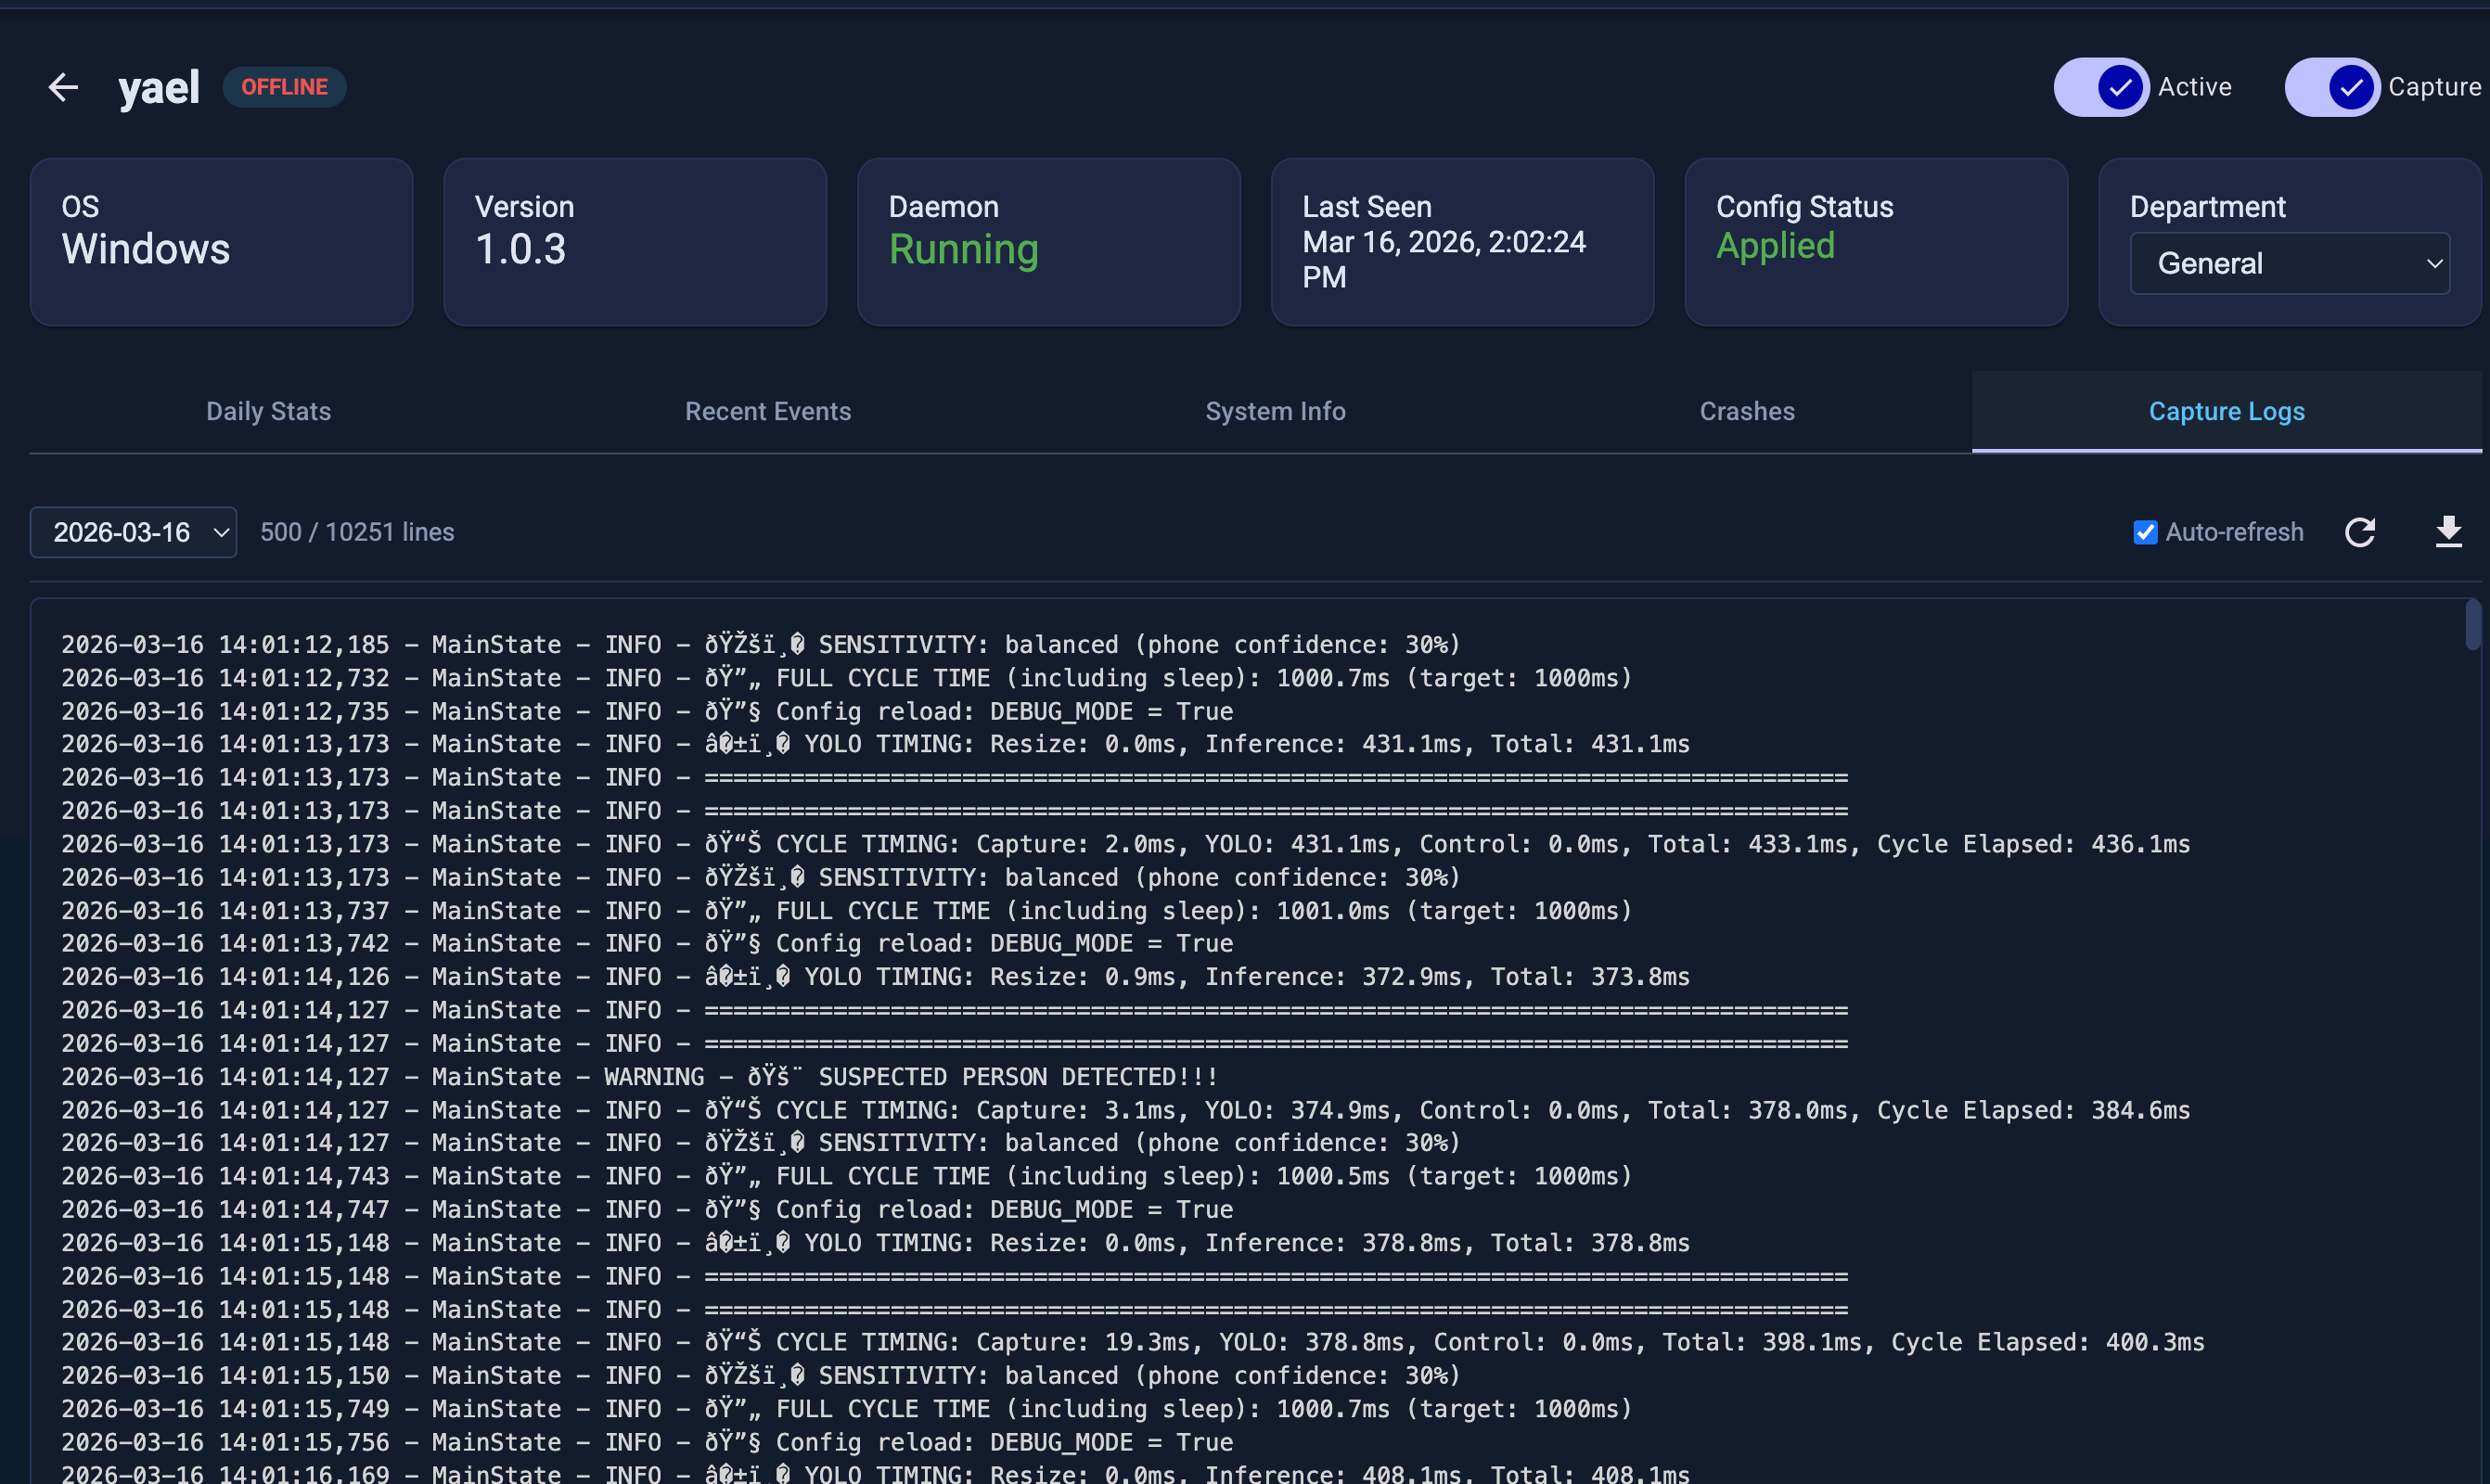
To enable Debug Mode:
- Go to Stations > select a station
- Toggle Capture on (top of station page)
- Open the Capture Logs tab to see live output
Use LOG_LEVEL = DEBUG for verbose output. Turn Debug Mode off when done.
Warning
Debug Mode stores camera frames on the dashboard server. Only enable it when actively investigating an incident.
Alerts & Notifications
Email alerts and SIEM forwarding are configured in Admin → Notifications.
Email Alerts
- Go to Admin → Notifications → Email (SMTP)
- Enter your SMTP server details and recipient addresses
- Click Save & Test to verify the connection
- Set thresholds in the Thresholds tab — alerts fire when a detection type exceeds the configured daily count
Alerts are de-duplicated: one email per event type per station per day.
SIEM / CEF Syslog
- Go to Admin → Notifications → SIEM
- Enter your SIEM host, port, and protocol (UDP or TCP)
- Enable and save — events are forwarded in CEF format immediately
Compatible with Splunk, QRadar, ArcSight, and any CEF-capable SIEM.
Alert Thresholds
Go to Admin → Notifications → Thresholds to set per-station and global daily thresholds per event type. Set to 0 to disable a threshold entirely.
AI Threat Analysis
The AI Analysis page automatically summarizes threat activity across all stations for a selected time period, highlights anomalies, and recommends actions.
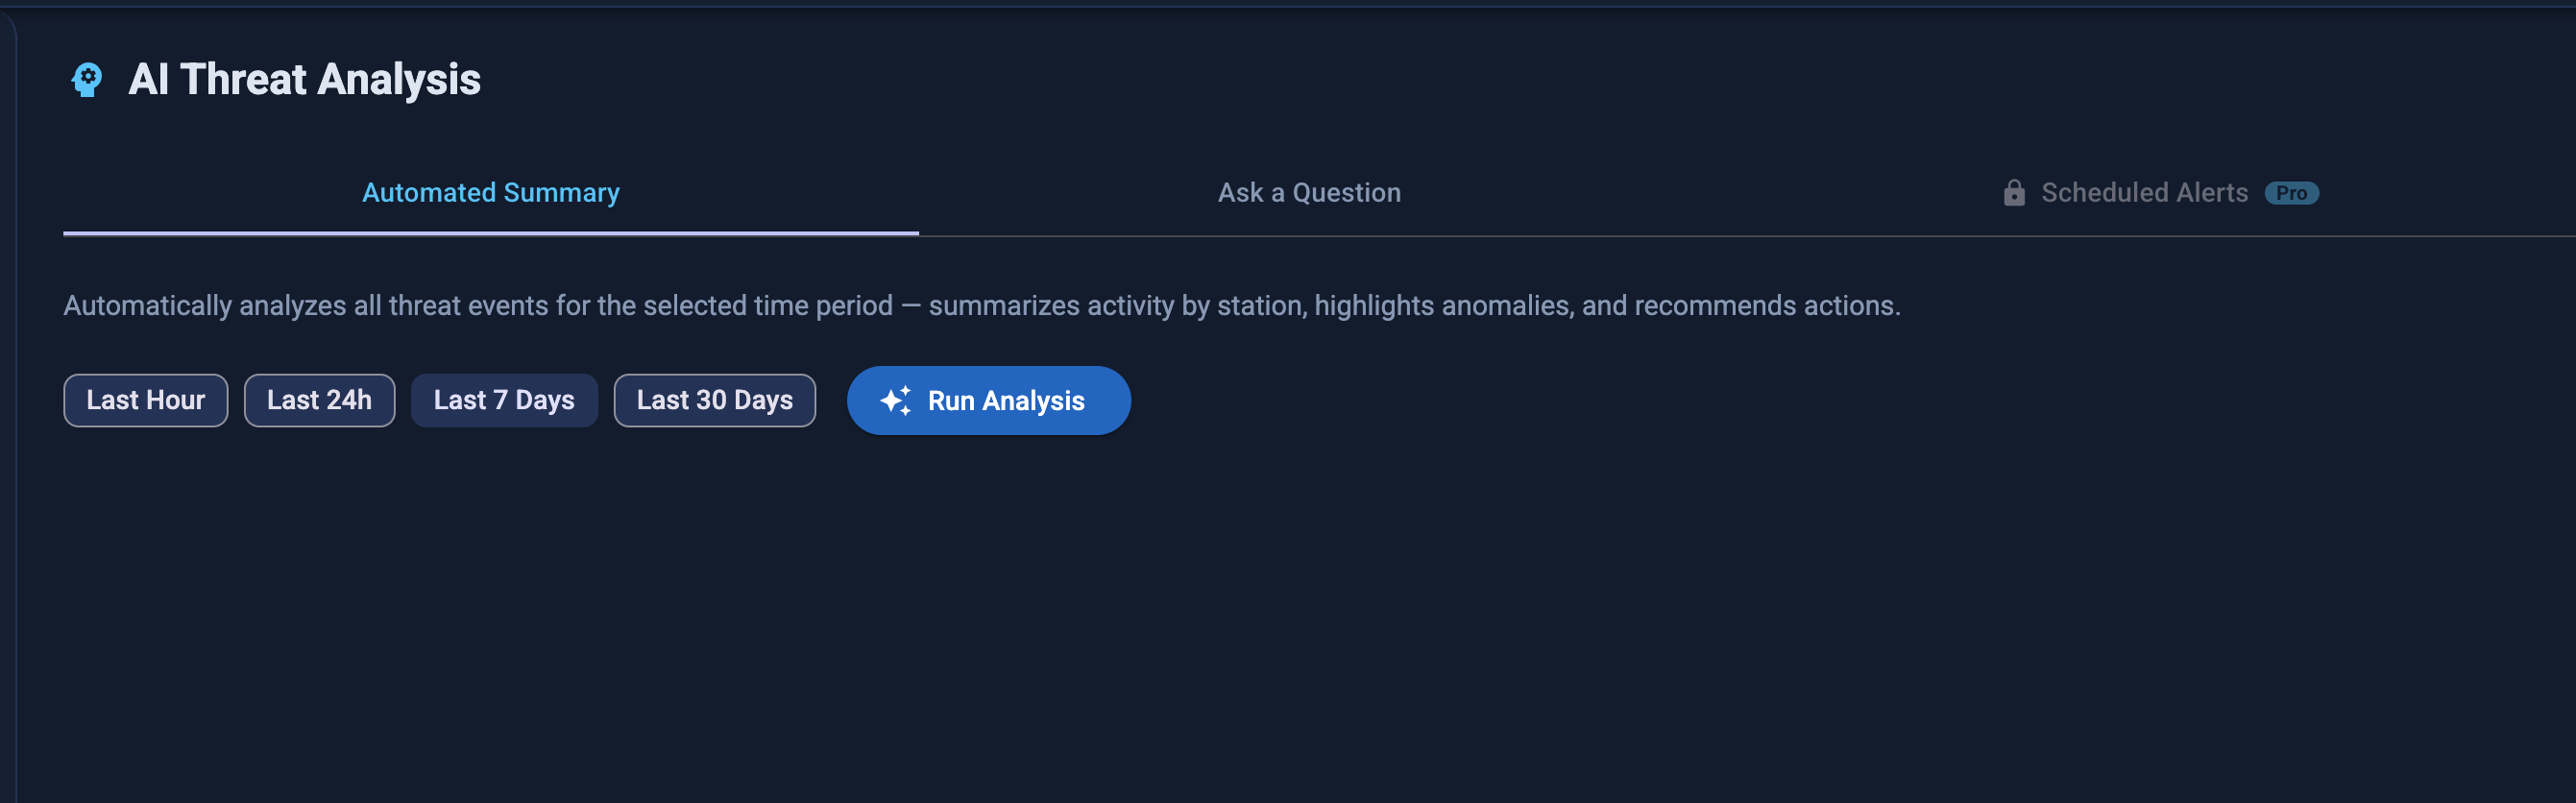
Select a time range (Last Hour, Last 24h, Last 7 Days, Last 30 Days) and click Run Analysis. The Ask a Question tab lets you query the event data in natural language.
Admin Panel
The Admin Panel is accessible to admin-role users only. It provides system-level management tools.
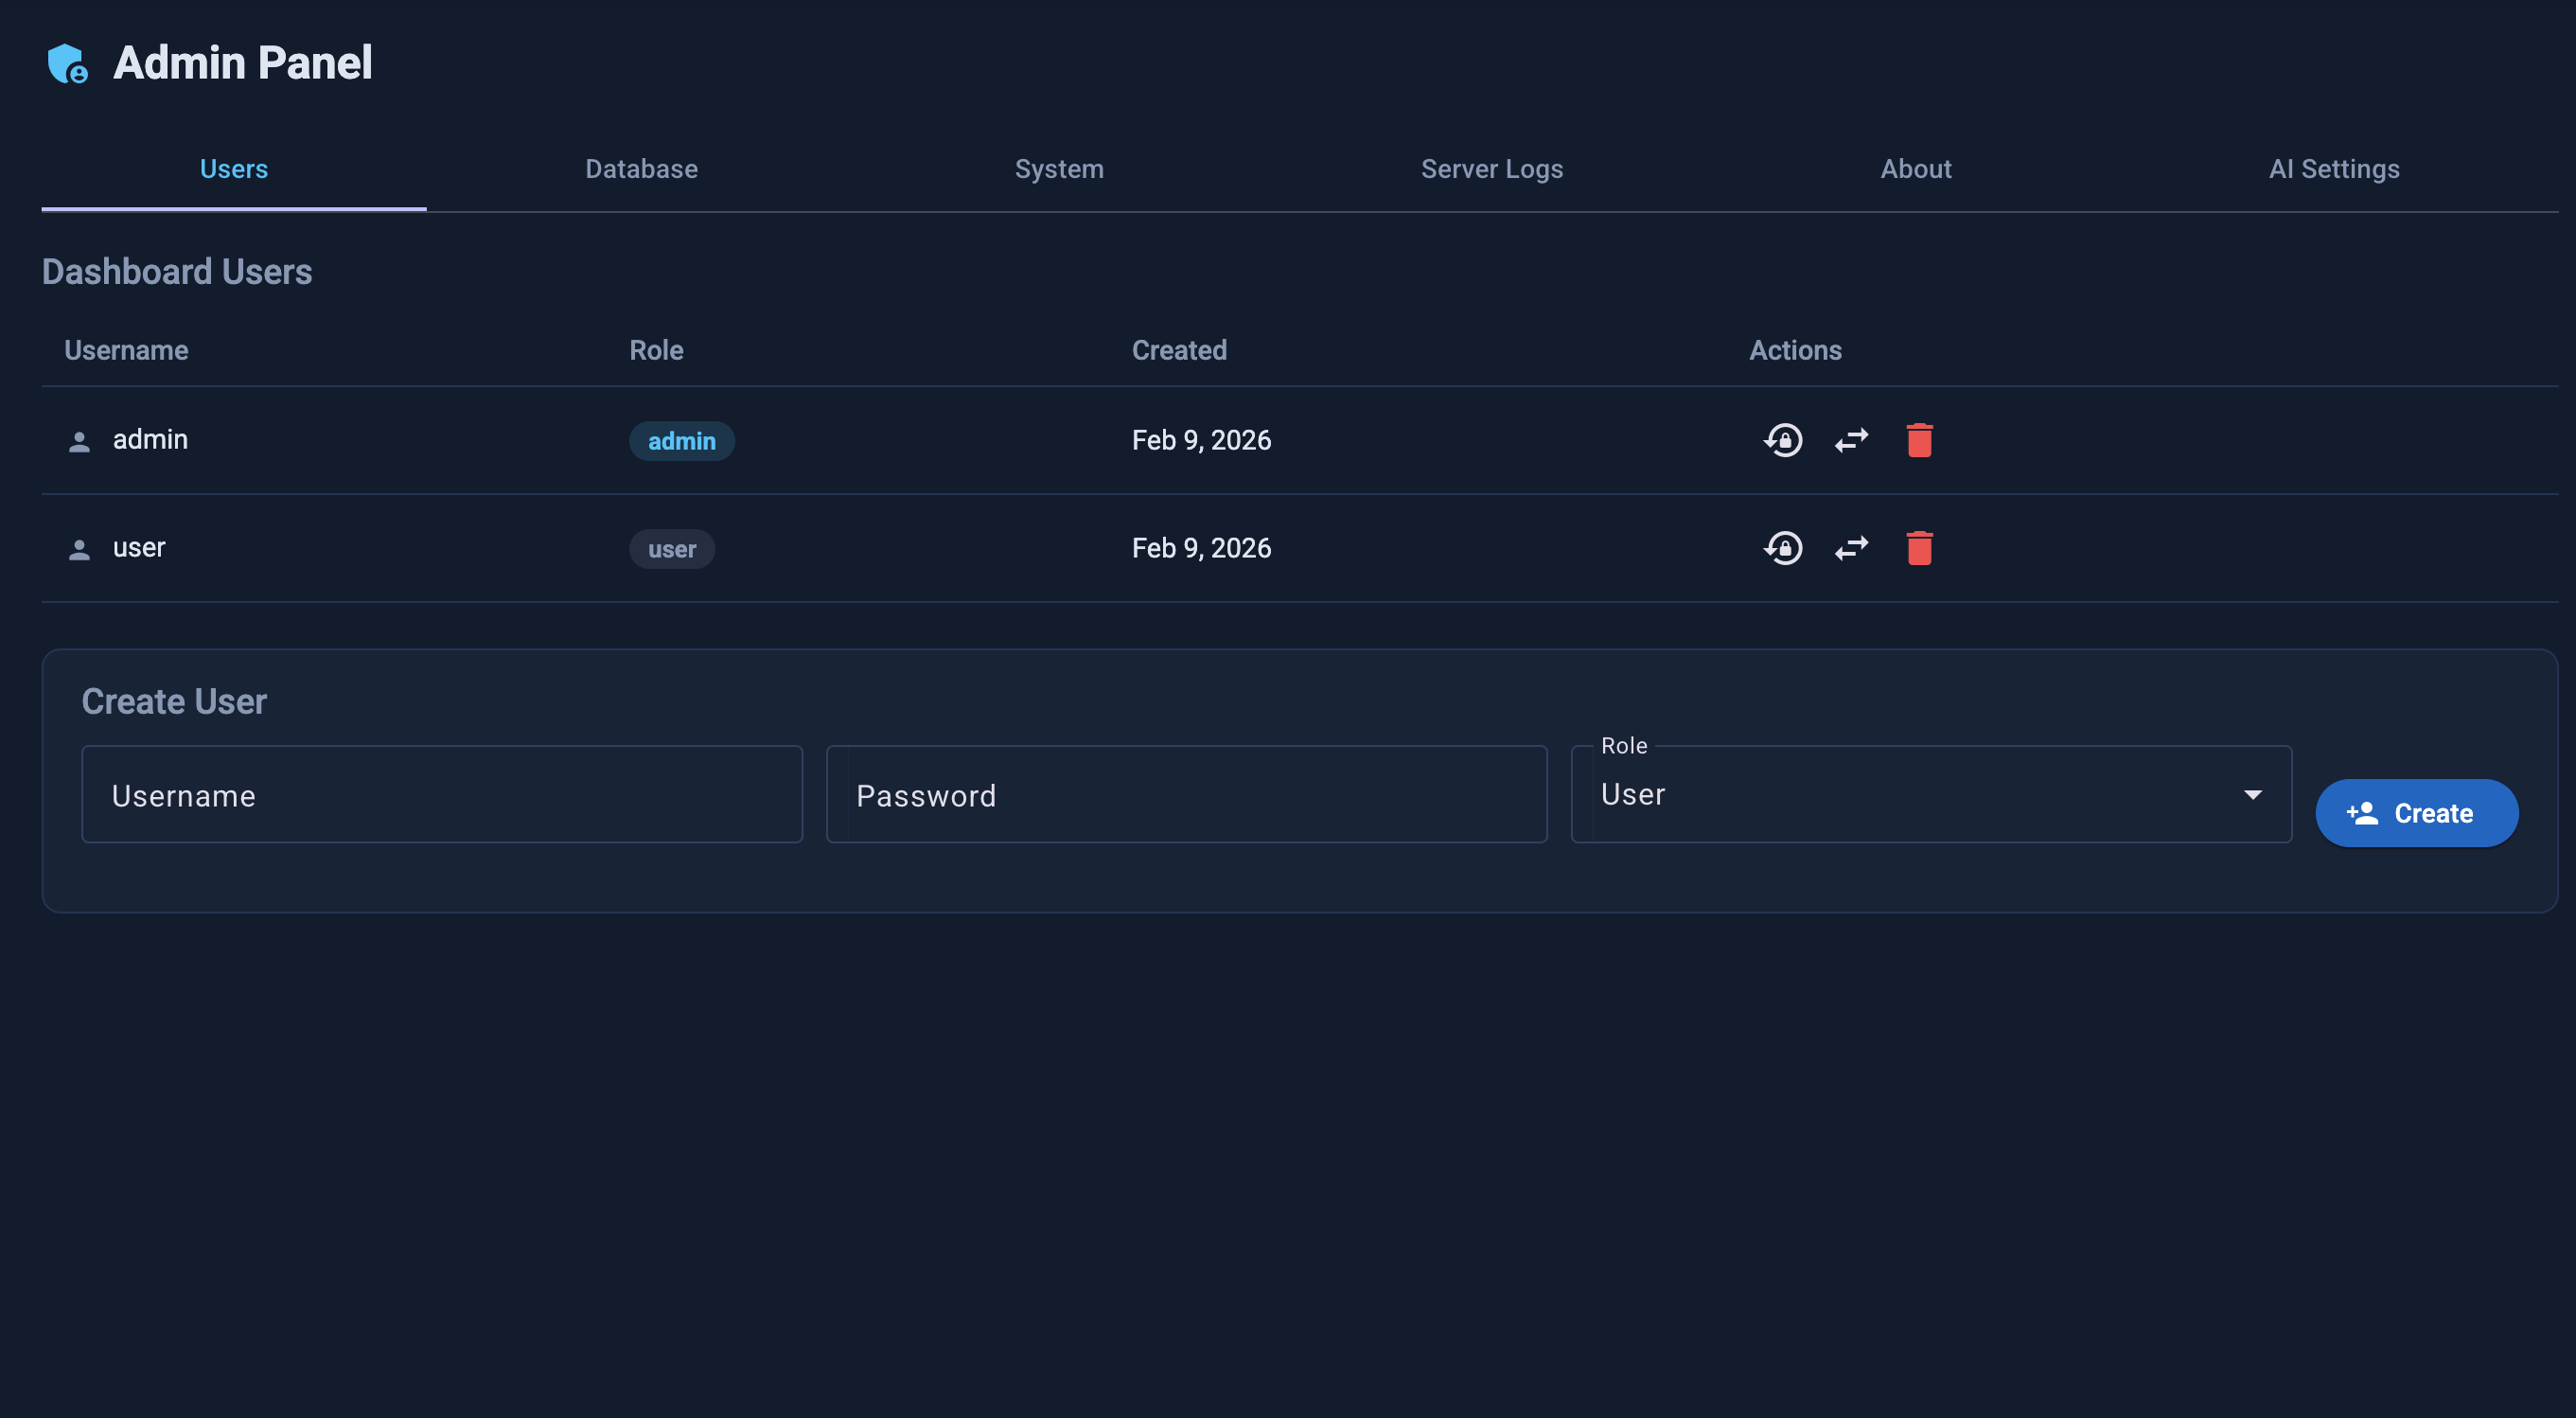
Users
Create and manage dashboard user accounts and assign roles.
Roles:
| Role | Capabilities |
|---|---|
| Admin | Full access — user management, system settings, all configuration |
| User | Read-only monitoring — view stations, events, departments; no configuration changes |
To create a user:
- Go to Admin → Users → Create User
- Enter username and password (min 12 chars, uppercase, lowercase, number, special character)
- Assign role: Admin or User
To reset a password:
- Go to Admin → Users
- Click the user → Reset Password
- Enter a new password meeting complexity requirements
Security notes: - Passwords are stored as bcrypt hashes (cost factor 12) — never in plaintext - Sessions expire on browser close (no persistent tokens) - Brute-force protection: login attempts are rate-limited at the reverse proxy (nginx) to 5/minute per IP, returning HTTP 429 on excess. For defense-in-depth, also use network-level controls (firewall, VPN) to restrict dashboard access to trusted networks.
Maintenance
The Maintenance tab shows server disk usage and lets you manage stored data.
Server Disk
A usage bar shows how much of the server's disk is occupied. The bar turns yellow at 80% and red at 95%. The two main consumers are detection frames and the events database.
Events
| Field | Description |
|---|---|
| Total events | Number of detection events in the database |
| Database size | Size of the SQLite database file on disk |
| Oldest / Newest | Date range of stored events |
To delete old events:
- Enter the number of days in the Older than (days) field
- Click Delete — events older than that threshold are permanently removed
- Set to
0to delete all events
Events are lightweight records (timestamp, type, confidence score). Deleting old events does not affect detection frames.
Detection Frames
Camera snapshots saved when Debug Mode or Capture Mode is active. These are the largest disk consumers.
| Field | Description |
|---|---|
| Total frames | Number of .jpg files stored on the server |
| Storage used | Total disk space occupied by frames |
| Oldest / Newest | Date range of stored frames |
To back up frames:
- Enter the age threshold in Older than (days)
- Click Backup — a ZIP file is generated and downloaded to your browser
To delete frames:
- Enter the age threshold in Older than (days)
- Click Delete — frames older than that threshold are permanently removed from the server
- Set to
0to delete all frames
Tip
Run Backup before Delete if you need to retain frames for compliance or forensic purposes.
Warning
Deletion is permanent and cannot be undone. Ensure your data retention policy permits deletion before proceeding.
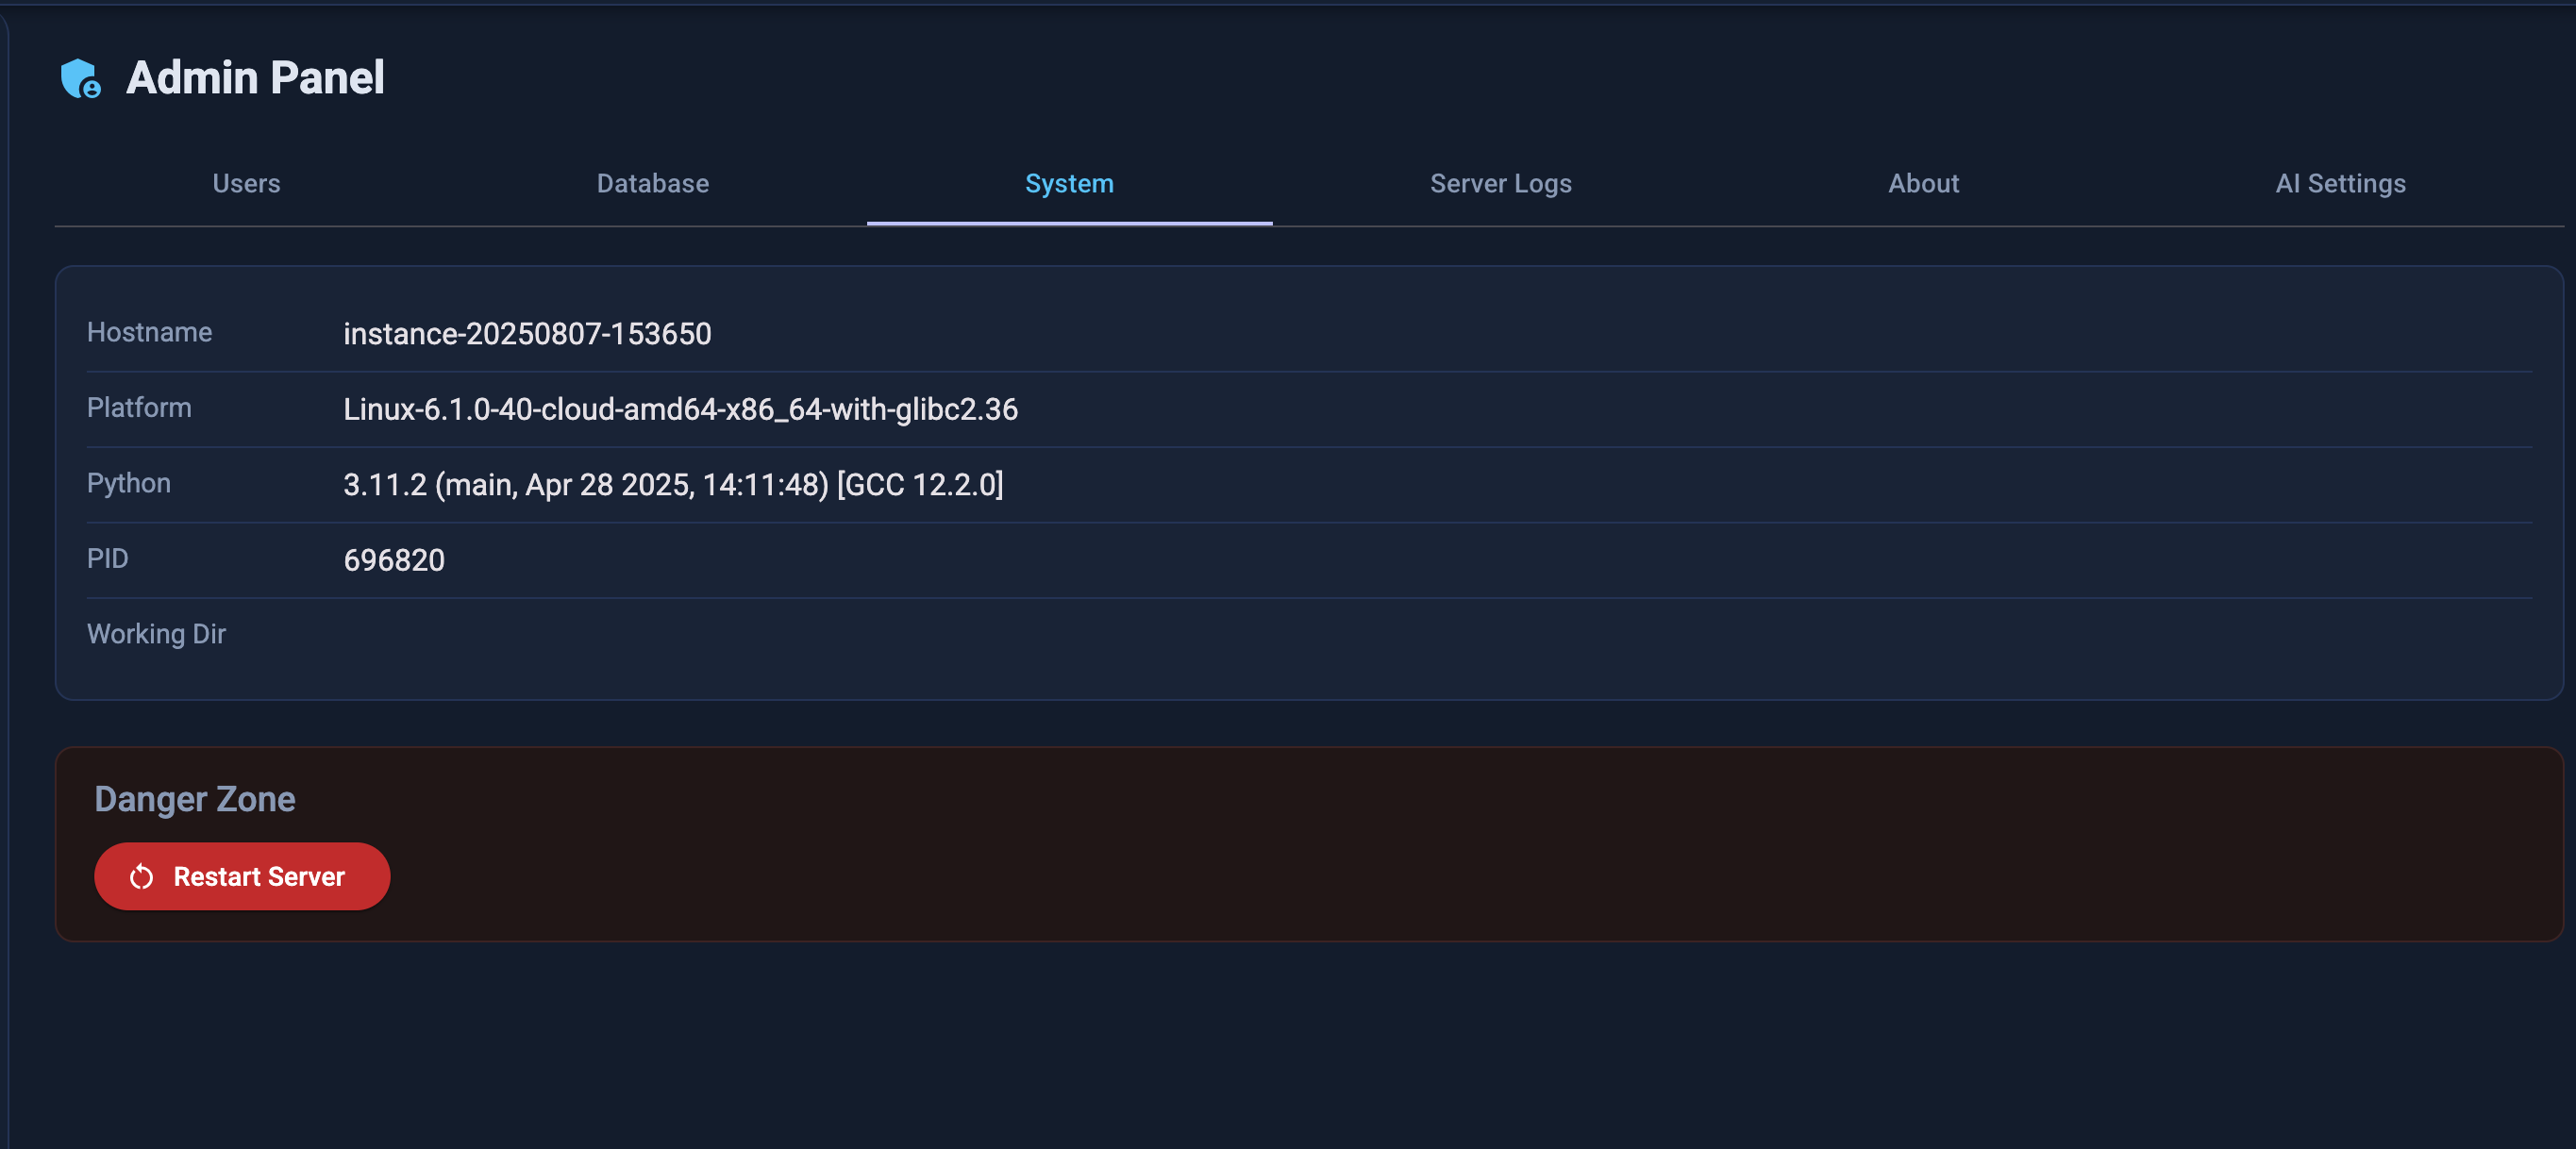
System
View server platform details and restart the server if needed.
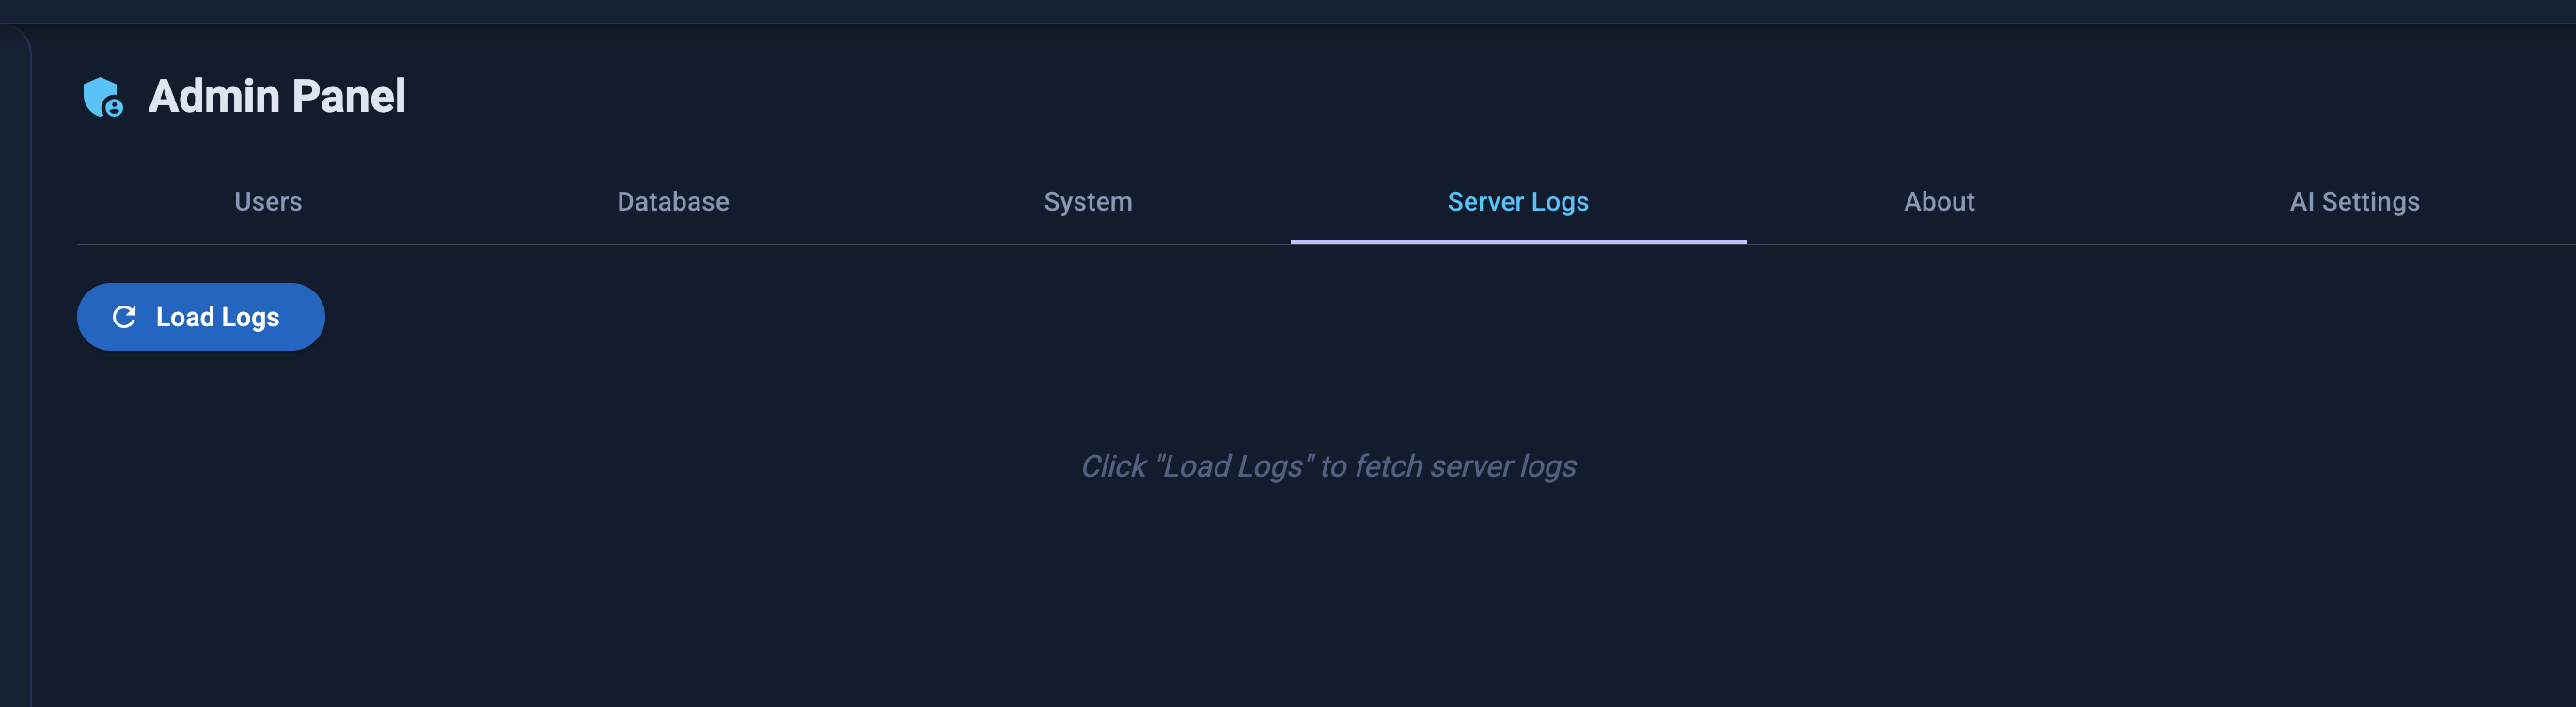
Server Logs
Fetch live server-side logs for troubleshooting.
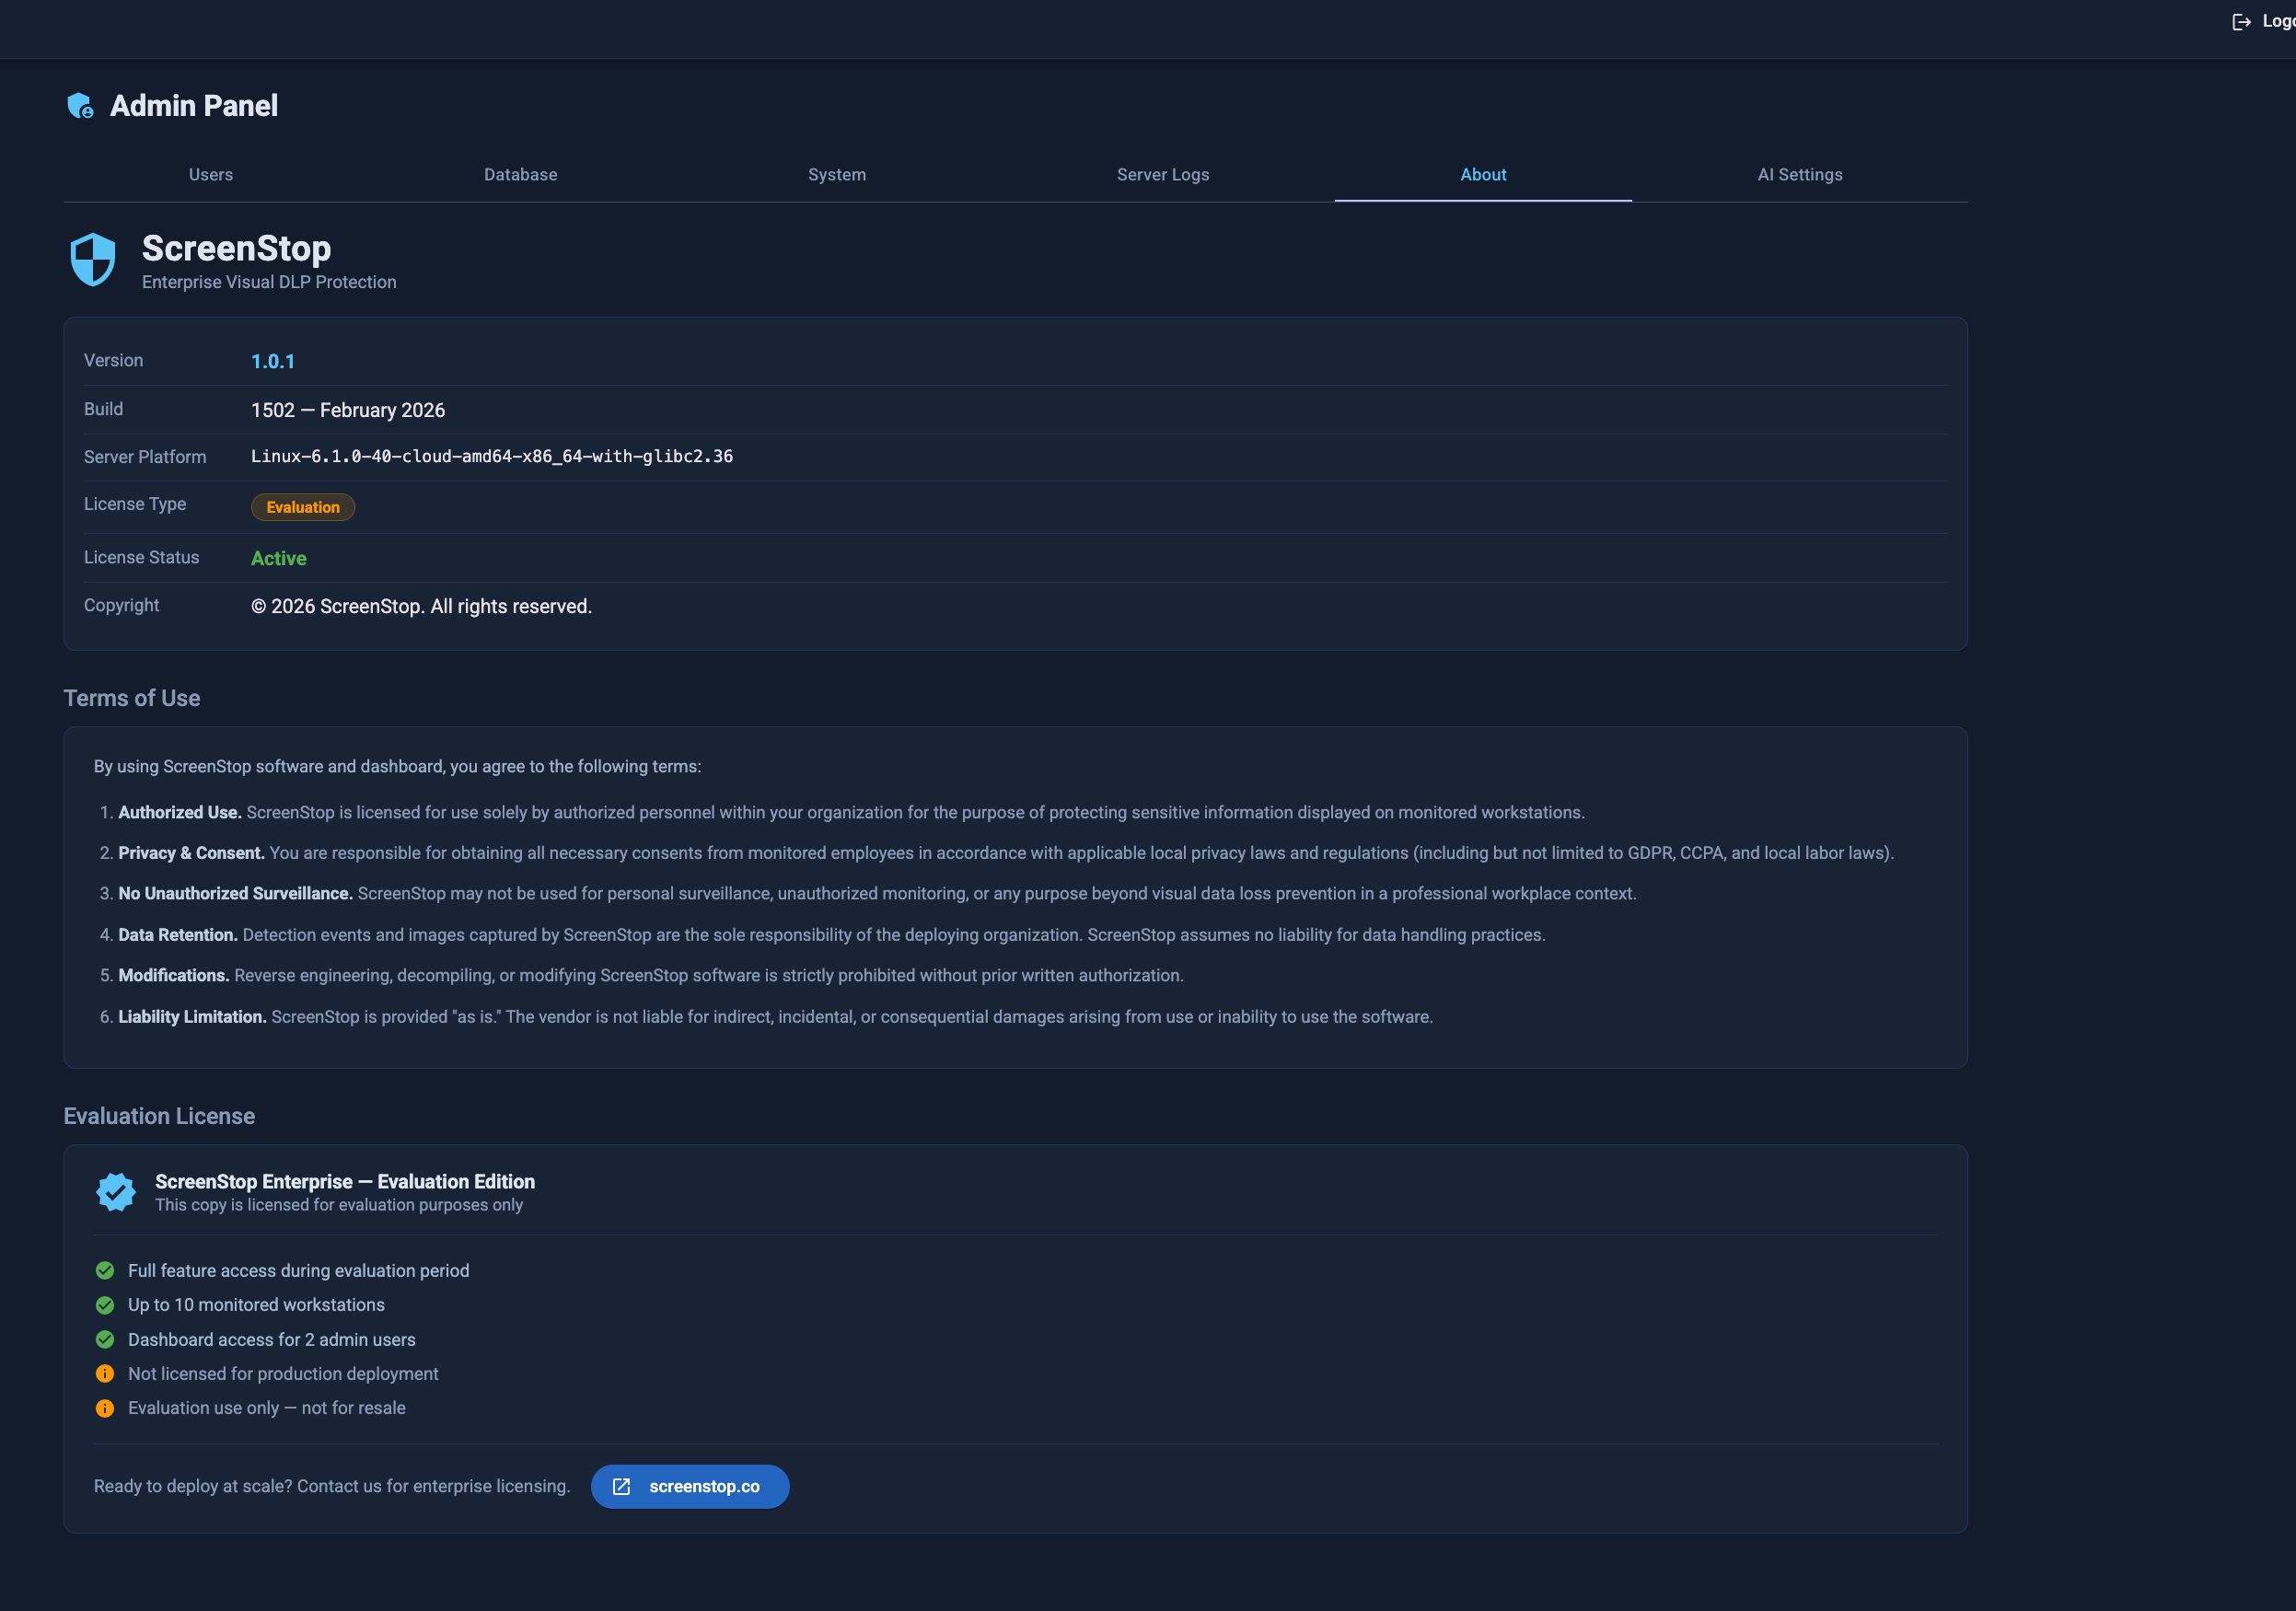
About
View the installed version, license type, and license terms.
Notifications
Configure email alerts (SMTP) and SIEM/CEF syslog forwarding. Set per-event-type thresholds for per-station and global alerts. See Alerts & Notifications above for full details.
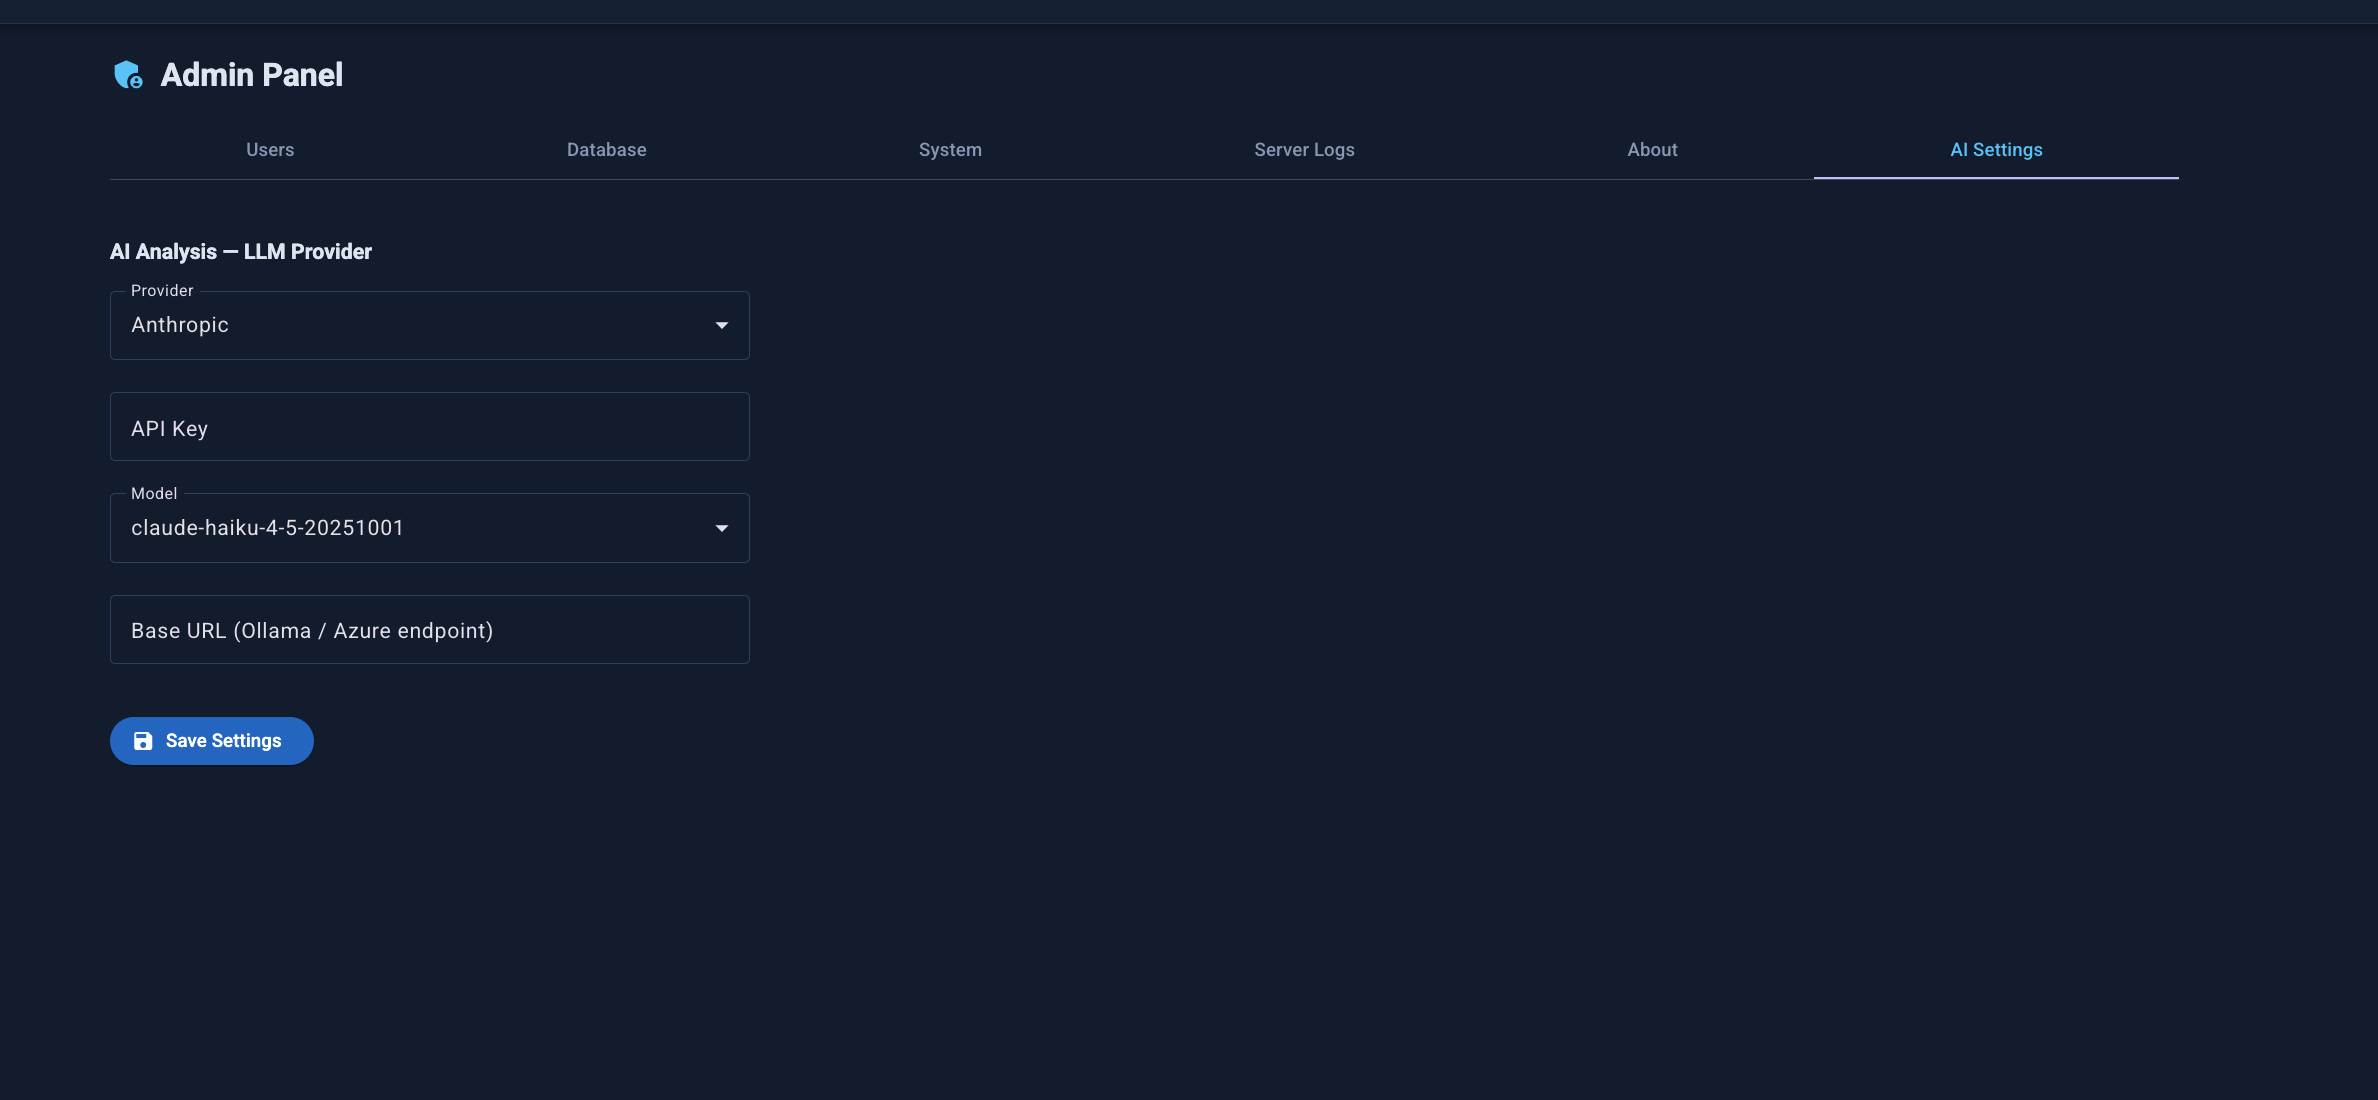
AI Settings
Configure the LLM provider (Anthropic, OpenAI, or Ollama/Azure) used by the AI Analysis feature.